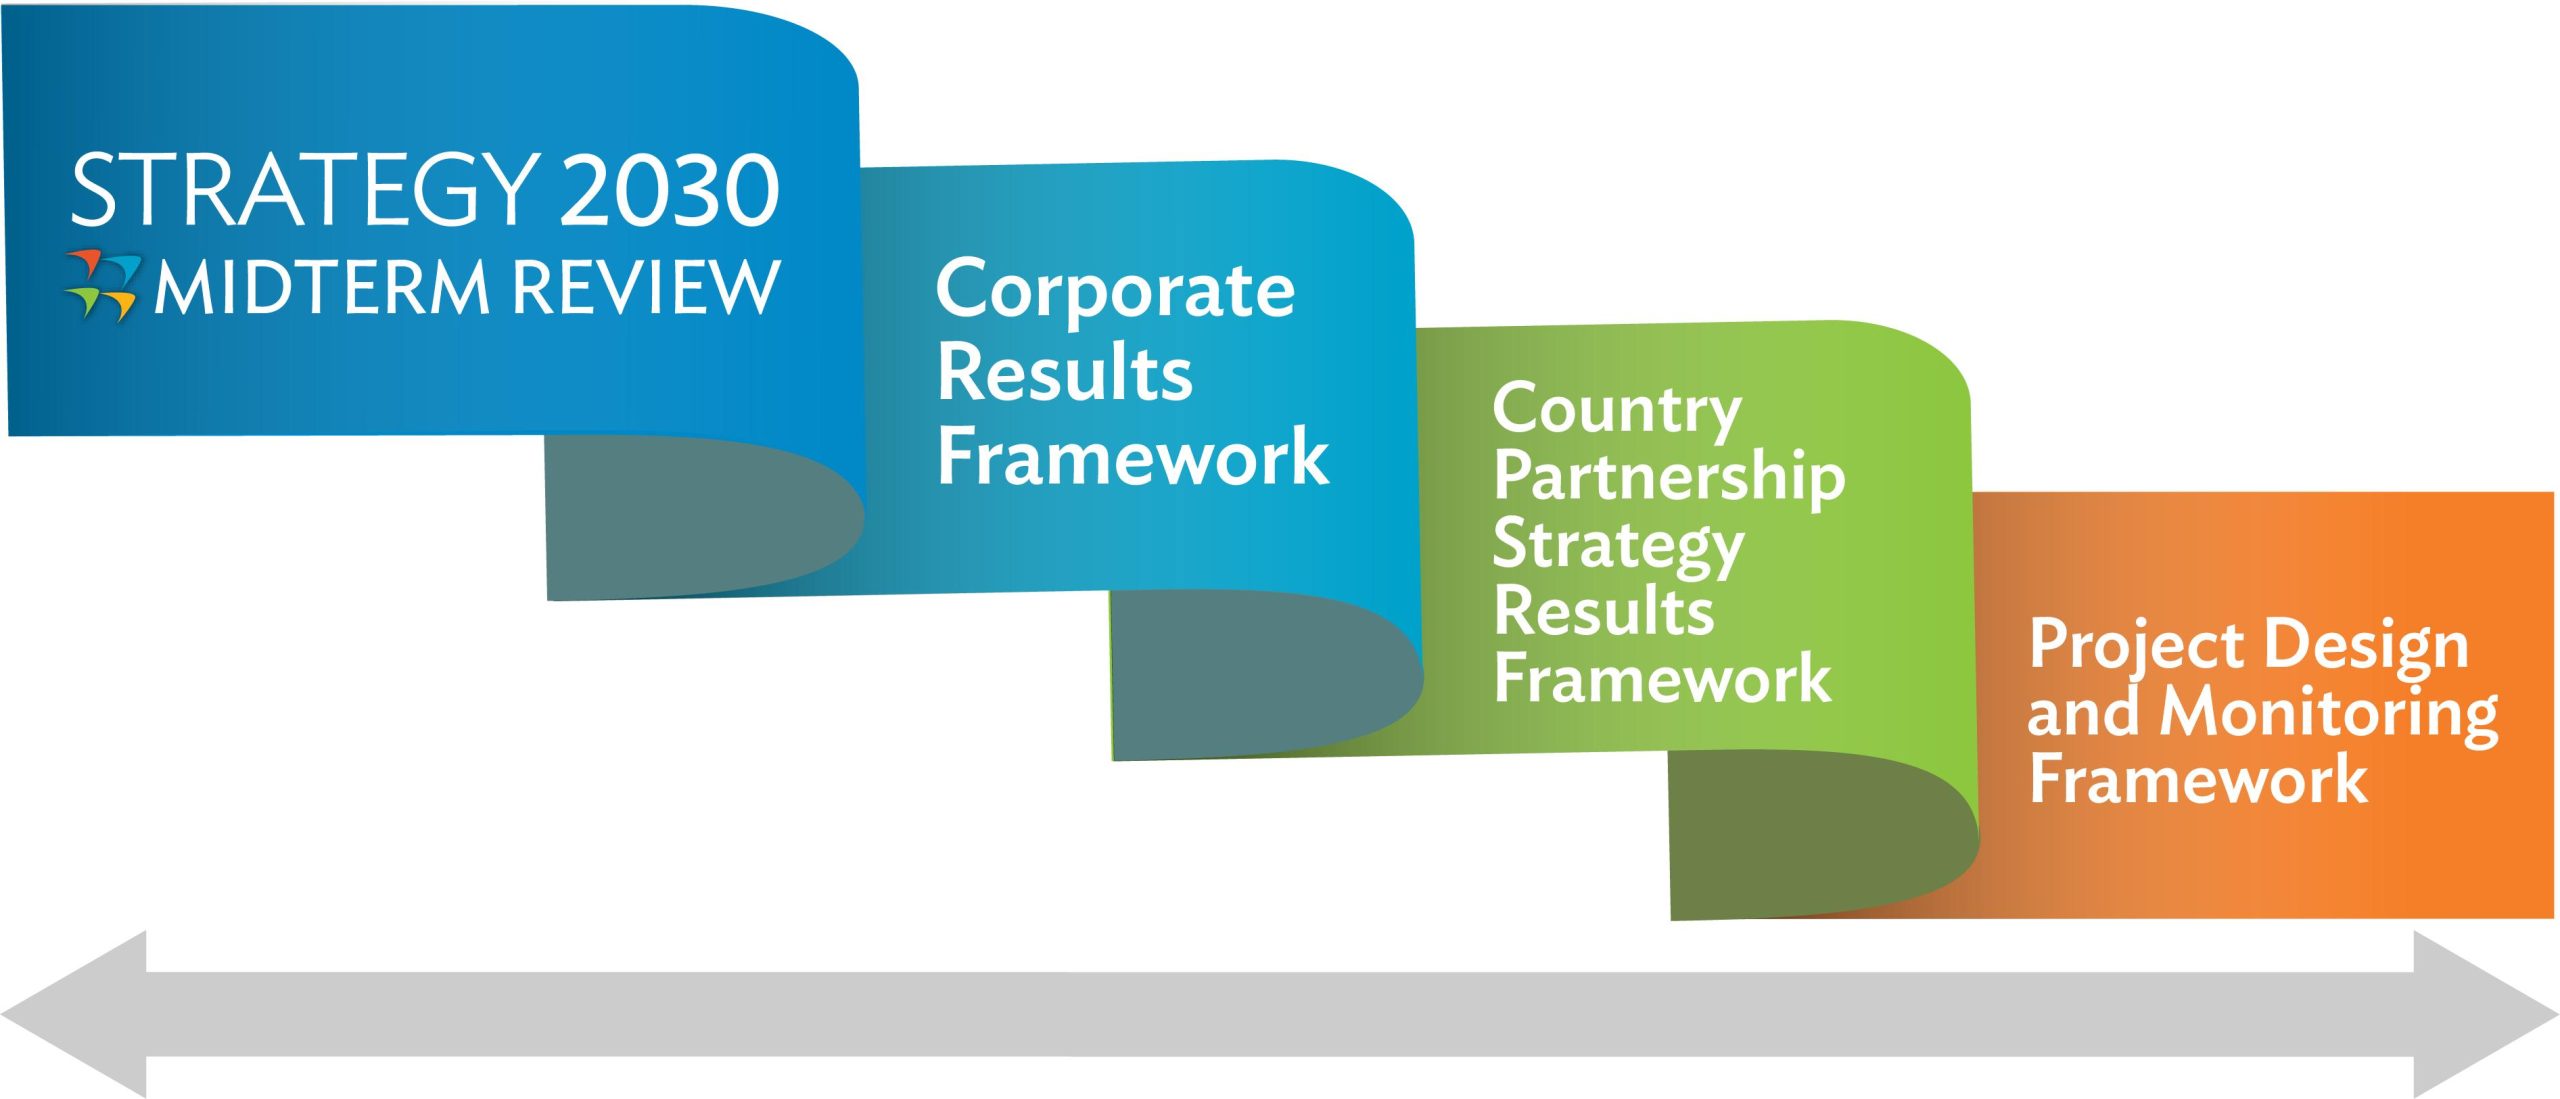
How ADB Manages for Development Outcomes
ADB reports on progress in delivering its Strategy 2030 and its Midterm Review using a results framework with indicators that cascade across all levels of the organization operationally and programmatically.
ADB’s New Corporate Scorecard Sets an Ambitious Path for Greater Development Effectiveness
The framework builds on earlier results frameworks and aims to enhance development impact by rationalizing and streamlining indicators, strengthening methodological rigor to improve credibility, and prioritizing outcome-oriented metrics that are harmonized across multilateral development banks (MDBs).
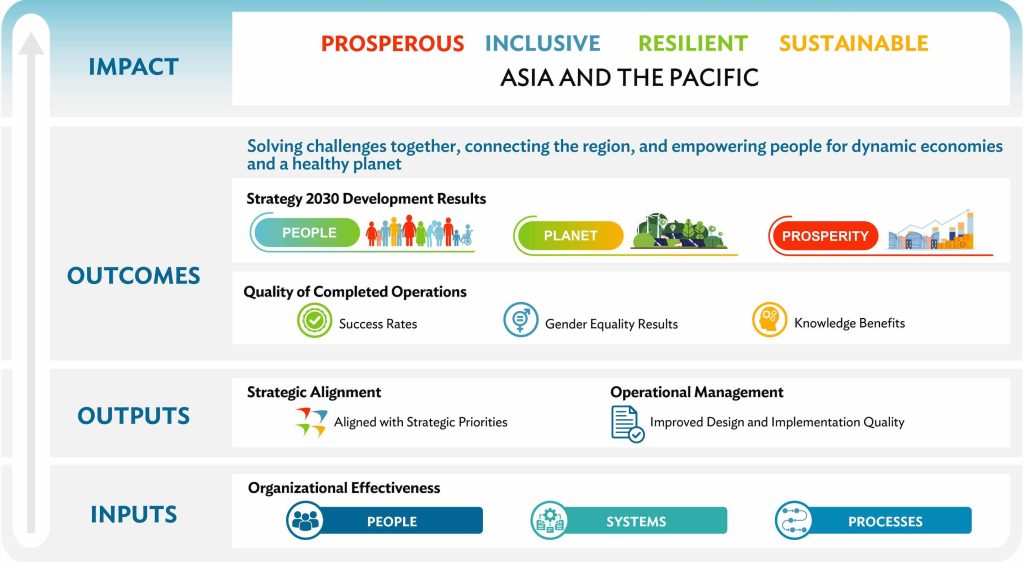
Measures ADB’s contribution to development outcomes in Asia and the Pacific, with outcome-oriented indicators aligned with Strategy 2030 priorities and the Sustainable Development Goals (SDGs), focusing on people, planet, and prosperity.
Assesses how well ADB’s operations and financing align with its corporate priorities, including climate action, private sector development, gender equality, and regional cooperation.
Tracks the efficiency and quality of ADB’s operational processes, including project preparation, implementation performance, portfolio quality, and use of resources.
Evaluates ADB’s institutional capacity to deliver results, covering financial sustainability, human resources, business processes, and internal systems that support effective operations.
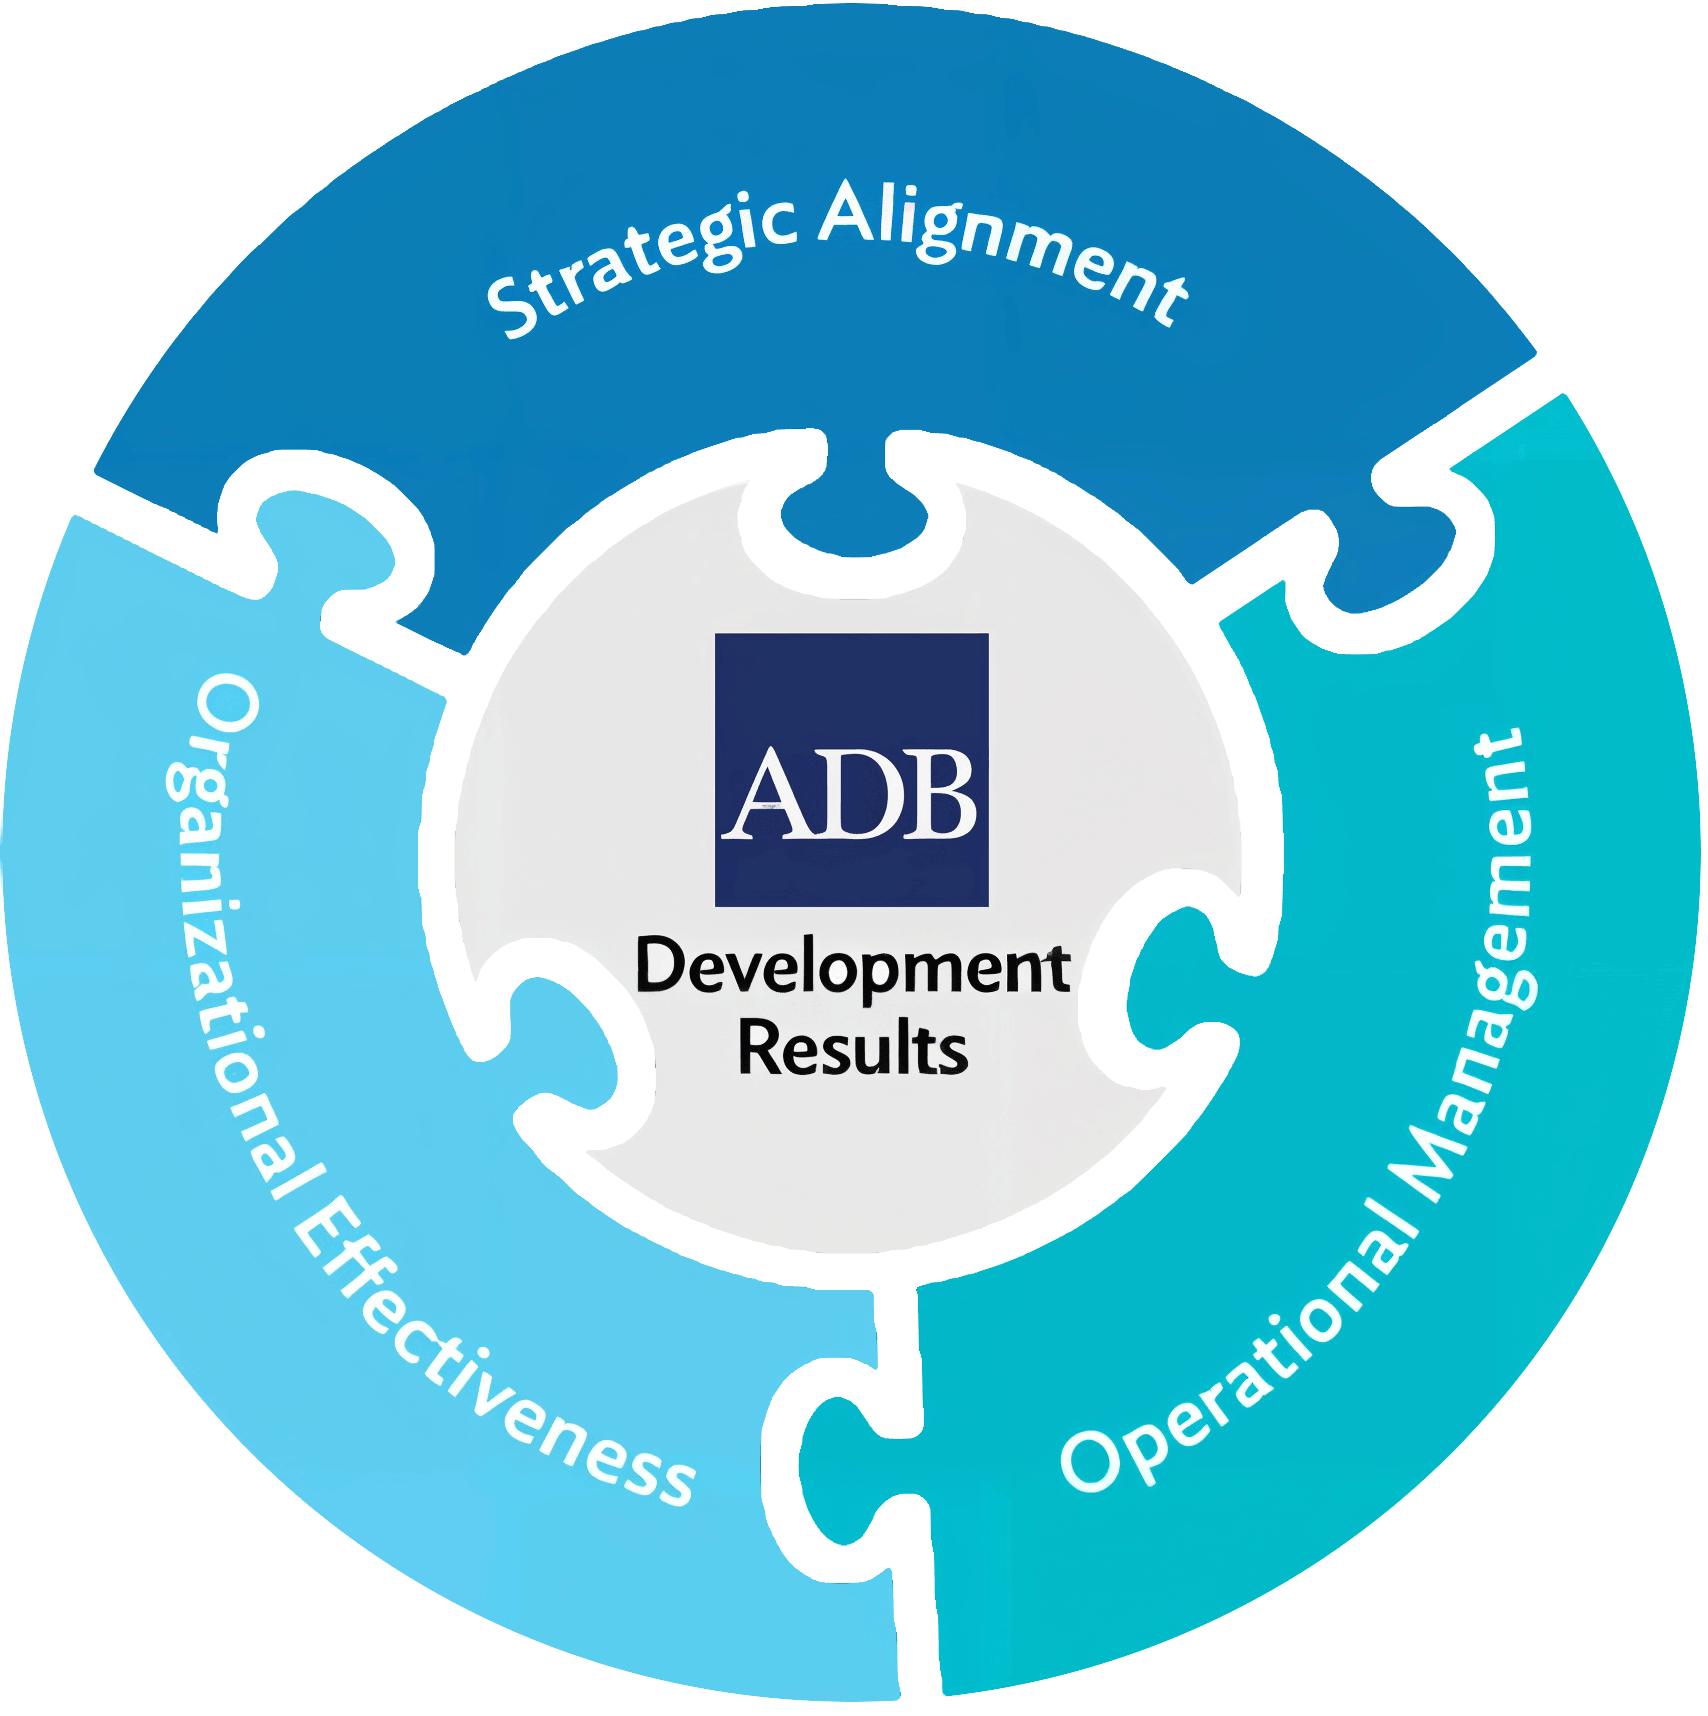
Performance Areas in the Corporate Results Framework 2025-2030
To assess ADB’s performance in delivering the priorities of the Midterm Review of Strategy 2030, the corporate results framework (CRF), 2025–2030 serves as the primary management tool for monitoring progress in implementing ADB’s corporate strategy. The CRF comprises 35 results indicators across four performance areas: (i) ADB’s development results, (ii) strategic alignment, (iii) operational management, and (iv) organizational effectiveness. It integrates CRF indicators with key portfolio performance indicators to provide a comprehensive assessment of how effectively ADB operations are prepared, implemented, and translated into development outcomes.
ADB corporate results framework
Development Results
View more
Quality of Completed Operations
View more
Strategic Alignment
View more
Operational Management
View more
Organizational Effectiveness
View more
Development Results
ADB Overall
People
- 77.4 million
poor and vulnerable people with improved living standards (DR1)
Results Achieved77,363,000
Achievement Rate (%)80
Definition
Calculations:
Number:
Total number of people in poverty and/or in vulnerable situations benefiting from improved standards of living under ADB projects.
Achievement rate:
Calculated using the ratio of the aggregate amount of results reported in project completion reports (PCR), technical assistance completion reports (TCR) or extended annual review reports (XARR) published in the reporting year (numerator), as having been achieved by ADB-supported operations to the planned results as reported in reports and recommendations of the President (RRP) for the same operations (denominator).
Definitions:
“People in poverty” are those from households living on less than $2.15 a day using 2017 prices.
“People in vulnerable situations” refers to (as relevant for a particular project) people who by virtue of their age, sex, gender, sexual orientation and gender identity, ethnicity, religion, disability, social and civic or health status, economic disadvantage or indigenous status, and/or dependence on unique natural resources, may be more limited than others in their ability to and/or excluded from/unable to participate fully in benefit sharing.
“Improved standards of living” refer to improved access to basic infrastructure and services (social and economic), which are:
- Benefits from improved infrastructure services by the poor and vulnerable, including:
- Use of roads and bridges constructed or upgraded
- Use of transportation systems constructed or improved
- Use of electricity, sewerage, water, sanitation, and solid waste management facilities constructed or improved
- Use of flood-control facilities constructed, and flood forecasting and warning systems established
- Use of subsidized or low-cost housing and shelter constructed
- Use of other improved services as set out in the DMF.
- Benefits from improved financial services by the poor and vulnerable, including:
- Transaction accounts opened to enable people to easily receive government benefits (pensions, aid, and cash) through electronic payments
- Secure and convenient access to credit, savings, and insurance
- Improved access to finance and e-commerce opportunities for micro, small, and medium-sized enterprises using their digital footprints.
- Other improvements in standards of living as set out in the DMF.
Other notes:
Effect of ADB projects on poor and vulnerable individuals may be estimated based on coverage area and available census data on poverty and vulnerability incidence in the project area, or other relevant estimated methodology. Sex-disaggregation may be estimated from the household data, based on average household composition.
Where cases of double-counting can be identified, the same individual benefiting from improved infrastructure and financial services under different ADB projects will only be counted once.
Available data disaggregation: Sex, age, disabilities, operation, country, subregion, fund source
Performance measurement: Achievement rate
Data source: Annual ADB data (expected and actual results taken from the latest approved DMF as reflected in project PCRs, TCRs, XARRs, and RRPs)
- 64.7 million
people benefiting from improved health and education services, and social protection (DR2)
Results Achieved64,744,000
Achievement Rate (%)78
Definition
Calculations:
Number: Total number of people benefitting from improved health services, education services, or social protection provided under ADB projects.
Achievement rate: Calculated using the ratio of the aggregate amount of results reported in project completion reports (PCR), technical assistance completion reports (TCR) or extended annual review reports (XARR) published in the reporting year (numerator), as having been achieved by ADB-supported operations to the planned results as reported in reports and recommendations of the President (RRP) for the same operations (denominator).
Definitions:
Health services include those identified by DMCs as part of their essential or basic health services, or their national health insurance basic benefit package. The identification by DMCs can be through a formal policy statement or, in the absence of a formal policy statement, a written confirmation by senior government health officials.
“Improved health services” refer to those with improved quality including to prevent, detect, and respond to health emergencies, and/or expanded geographical, physical, and financial access including through the establishment of health facilities with ADB support. “Increased quality of health services” will be determined on a project or country basis.
“Establishment of health facilities” refers to the construction or upgrading of hospitals, health centers, and other facilities that provide health services.
“Benefit from improved health services” refers to actual use of better-quality health services, such as people hospitalized with health insurance coverage, mothers delivering babies in new hospitals, and children vaccinated in new urban health centers, all with ADB support.
“Improved education services” refers to all levels of education including preprimary, primary, secondary, tertiary, formal technical and vocational education, non-formal education such as training, life-long learning, re- and up-skilling, and industry-run academies, and higher education, that have introduced reforms to improve the learning outcomes or employability of those enrolled.
“Benefit from improved education services” refers to:
- Students educated under improved quality assurance systems
- Teachers trained with quality or improved competency standards
- Students using new or improved education facilities
- Professional training e.g. doctors, nurses, engineers, technicians trained under improved standards
- Other relevant education and training enrollment as indicated in project DMF.
Social protection refers to a set of policies and programs designed to reduce poverty and vulnerability by promoting labor market functioning, diminishing people’s exposure to risks and enhancing their capacity to protect themselves against hazards and the interruption or loss of income.
Social assistance refers to publicly funded transfers and services for the most vulnerable groups with no other means of adequate support. Examples include welfare assistance (e.g., cash or in-kind transfer and social care services), social pensions, child grants, and other universal programs, health assistance, and disability benefits.
Social insurance pertains to contributory schemes to cushion the risks associated with old age, health, disability, work injury, and unemployment. Examples include pensions, health insurance, other social insurance such as unemployment and disability insurance, maternity benefits, benefits from provident funds.
Labor market policies and programs are designed to facilitate employment and to promote the efficient operation of the labor markets. Examples include skills development and training, public works programs such as cash-for-work or food-for-work, and core labor standards.
“Benefit from improved social protection” refers to individuals receiving social assistance (and all members of a household when assistance is household-based), or registered under any social insurance scheme, or participating in any active labor market program.
Other notes:
Total number of individuals may be estimated based on coverage area or other relevant estimated methodology. Sex-disaggregation may be estimated from the household data, based on average household composition.
Where cases of double-counting can be identified, the same individual benefiting from improved health and education services and/or social protection under different ADB projects will only be counted once.
Available data disaggregation: Sex, age, disabilities, operation, country, subregion, fund source
Performance measurement: Achievement rate
Data source: Annual ADB data (expected and actual results taken from the latest approved DMF as reflected in project PCRs, TCRs, XARRs, and RRPs)
- 104.5 million
people benefiting from improved infrastructure, financial, and economic services (DR3)
Results Achieved104,463,000
Achievement Rate (%)100+
Definition
Calculations:
Number: Total number of people benefiting from improved services under ADB projects.
Achievement rate: Calculated using the ratio of the aggregate amount of results reported in project completion reports (PCR), technical assistance completion reports (TCR) or extended annual review reports (XARR) published in the reporting year (numerator), as having been achieved by ADB-supported operations to the planned results as reported in reports and recommendations of the President (RRP) for the same operations (denominator).
Definitions:
“Improved services” refer to:
Infrastructure services including:
- Roads and bridges constructed or upgraded
- Electricity, sewerage, water, sanitation, and solid waste management facilities
- Telecommunications and information and communication technology
- Flood-control facilities constructed, and flood forecasting and warning systems established
- Low-cost housing constructed
- Other improved infrastructure services as indicated in the DMF.
Financial services including:
- Secure and convenient access to credit, savings, and insurance
- Improved access to finance and e-commerce opportunities for micro, small, and medium-sized enterprises
- Other improved financial services as indicated in the DMF.
Economic services including:
- Agro-processing facilities and services
- Marketing (wholesale and retail)
- Transport and distribution facilities and service
- Agricultural and other livelihood training
- Other economic services as indicated in the DMF.
Other notes:
The same individual benefiting from improvements in more than one services under different ADB projects will only be counted once, where cases of double-counting are identified. An improvement in services will be determined by comparison of post-project quality, access and reliability as defined in a DMF for a relevant project, with a baseline at the start of the project.
Total number of individuals may be estimated based on the coverage area. Sex-disaggregation may be estimated from the household data, based on average household composition. This indicator is a subset of development results indicator number 1.
Available data disaggregation: Sex, operation, country, subregion, fund source
Performance measurement: Achievement rate
Data source: Annual ADB data (expected and actual results taken from the latest approved DMF as reflected in project PCRs, TCRs, XARRs, and RRPs)
- 5.9 million
women and girls benefiting from greater gender equality (DR4)
Results Achieved5,929,000
Achievement Rate (%)100+
Definition
Calculations:
Number: Total number of women and girls with (i) increased economic empowerment (e.g., access to finance and access to financial skills); (ii) benefiting from transformative gender equality initiatives (e.g., with improved time savings, access to gender-based violence (GBV) services, access to healthcare services addressing sexual and reproductive health and rights (SRHR), and leadership and decision making).
Achievement rate: Calculated using the ratio of the aggregate amount of results reported in project completion reports (PCR), technical assistance completion reports (TCR) or extended annual review reports (XARR) published in the reporting year (numerator), as having been achieved by ADB-supported operations to the planned results as reported in reports and recommendations of the President (RRP) for the same operations (denominator).
Other notes:
Where cases of double-counting can be identified, the same individual benefiting from improvements in more than one area under different ADB projects will only be counted once.
Total number of individuals may be estimated based on the coverage area.
Available data disaggregation: Operation, country, subregion, financing
Performance measurement: Achievement rate
Data source: Annual ADB data (expected and actual results taken from the latest approved DMF as reflected in project PCRs, TCRs, XARRs, and RRPs)
Planet
- 12.9 million
tCO₂e/year in reduced greenhouse gas emissions (DR5)
Results Achieved 12,863,000
Achievement Rate (%)100+
Definition
Calculations:
Net emissions: The total net carbon dioxide equivalent emission avoided as a result of ADB projects or components of projects. A baseline will be established to determine the emissions that would have occurred in the absence of the project. This involves calculating the GHG emissions from the existing situation or the scenario before the project’s implementation. Then GHG emissions resulting from the project itself will be calculated as well. The avoided emissions are the difference between the baseline emissions and the project emissions.
Achievement rate: calculated using the ratio of the aggregate amount of results reported in project completion reports (PCR), technical assistance completion reports (TCR) or extended annual review reports (XARR) published in the reporting year (numerator), as having been achieved by ADB-supported operations to the planned results as reported in reports and recommendations of the President (RRP) for the same operations (denominator).
Other notes:
Calculations for greenhouse gas reduction will be guided by ADB’s Guidelines for Estimating Greenhouse Gas Emissions as updated from time to time, as well as other internationally recognized methodologies.
Available data disaggregation: Operation, country, subregion, fund source
Performance measurement: Achievement rate
Data source: Annual ADB data (expected and actual results taken from the latest approved DMF as reflected in project PCRs, TCRs, XARRs, and RRPs)
- 1,500 megawatts
renewable energy capacity installed (DR6)
Results Achieved1,500
Achievement Rate (%)100+
Definition
Calculations:
Energy capacity: The total additional capacity in megawatts (MW) resulting from generation projects using renewable energy sources.
Achievement rate: Calculated using the ratio of the aggregate amount of results reported in project completion reports (PCR), technical assistance completion reports (TCR) or extended annual review reports (XARR) published in the reporting year (numerator), as having been achieved by ADB-supported operations to the planned results as reported in reports and recommendations of the President (RRP) for the same operations (denominator).
Definition:
Installed energy generation capacity from a renewable energy project is the rated capacity of a project or project component involving renewable energy technologies, such as solar, wind, small or mini hydro, geothermal, and biomass. The project may be either new construction or acquisition (e.g., acquisition of a government-owned small hydro plant by the private sector).
Available data disaggregation: Operation, country, subregion, fund source
Performance measurement: Achievement rate
Data sources: Annual ADB data (expected and actual results taken from the latest approved DMF as reflected in project PCRs, TCRs, XARRs, and RRPs)
- 33.2 million
people with strengthened climate and disaster resilience (DR7)
Results Achieved33,160,000
Achievement Rate (%)100+
Definition
Calculations:
Number: Total number of individuals who benefit from strengthened climate and disaster resilience under ADB projects.
Achievement rate: Calculated using the ratio of the aggregate amount of results reported in project completion reports (PCR), technical assistance completion reports (TCR) or extended annual review reports (XARR) published in the reporting year (numerator), as having been achieved by ADB-supported operations to the planned results as reported in reports and recommendations of the President (RRP) for the same operations (denominator).
Definition:
Strengthened climate and disaster resilience is the enhanced ability of an individual to resist, absorb, recover from, and reorganize in response to climate and disaster-related shocks and stresses, without jeopardizing their sustained socioeconomic development.
The benefits of ADB projects counted for the purpose of this indicator include:
- Use of retrofitted or new disaster-resilient facilities (e.g., housing, educational facilities, health care facilities, government offices)
- Use of stored water during periods of drought
- Reduced exposure to flooding
- Use of improved early warning information
- Financial protection against disaster damage and loss
- Use of new disaster risk management knowledge and skills (e.g., in livelihood decisions)
- Use of knowledge, skills, and competences on climate mitigation, adaptation, disaster risk, and early warning.
The number of people protected by contingent disaster financing, sovereign or subsovereign parametric insurance products, catastrophe bonds, and resilience bonds should be based on the total number of people in the relevant country affected by disasters over the past 20 years divided by the number of reported events (or, for subsovereign products, the total number of people in the subsovereign entity affected by disasters over the past 20 years divided by the number of reported events in that entity).
Other notes:
Where cases of double-counting can be identified, the same individual benefiting from improvements in more than one area under different ADB projects will only be counted once.
Total number of individuals may be estimated based on the coverage area. Sex-disaggregation may be estimated from the household data, based on average household composition.
Available data disaggregation: Sex, operation, country, subregion, fund source
Performance measurement: Achievement rate
Data source: Annual ADB data (expected and actual results taken from the latest approved DMF as reflected in project PCRs, TCRs, XARRs, and RRPs)
- 21.7 million
people with strengthened food and nutrition security (DR8)
Results Achieved21,661,000
Achievement Rate (%)68
Definition
Calculations:
Number: Total number of individuals who benefit from strengthened food and nutrition security under ADB projects.
Achievement rate: Calculated using the ratio of the aggregate amount of results reported in project completion reports (PCR), technical assistance completion reports (TCR) or extended annual review reports (XARR) published in the reporting year (numerator), as having been achieved by ADB-supported operations to the planned results as reported in reports and recommendations of the President (RRP) for the same operations (denominator).
Definition:
Operations across multiple sectors that strengthen food security may refer to interventions that may span the universally accepted dimensions of food security, including the availability of food, access to food, utilization of food and the stability of food systems. Examples of such interventions could include operations which relate directly to food production and consumption, such as climate resilient agriculture and food systems; social protection/social safety nets; nutrition services; supply chain, financial and trade finance operations that support food inputs, imports, and distribution of food, etc.; increase the income of small-scale food producers; water for agriculture; agricultural services, improved practices and technologies; integration of (smallholder) farmers to markets.
Food security is defined when all people, at all times, have physical and economic access to sufficient safe and nutritious food that meets their dietary needs and food preferences for an active and healthy life.
Other notes:
Where cases of double-counting can be identified, the same individual benefiting from improvements in more than one area under different ADB projects will only be counted once.
Available data disaggregation: Sex, operation, country, subregion, fund source
Performance measurement: Achievement rate
Data source: Annual ADB data (expected and actual results taken from the latest approved DMF as reflected in project PCRs, TCRs, XARRs, and RRPs)
- 585,000
hectares of land conserved, restored, enhanced, and/or under sustainable management (DR9)
Results Achieved585,000
Achievement Rate (%)29
Definition
Calculations:
Areas: Total hectares of terrestrial, aquatic, and atmospheric areas conserved, restored, enhanced and/or under sustainable management under ADB projects.
Achievement rate: Calculated using the ratio of the aggregate amount of results reported in project completion reports (PCR), technical assistance completion reports (TCR) or extended annual review reports (XARR) published in the reporting year (numerator), as having been achieved by ADB-supported operations to the planned results as reported in reports and recommendations of the President (RRP) for the same operations (denominator).
Definition:
This includes the area of:
- Terrestrial or aquatic protected areas newly created or under improved management effectiveness
- Terrestrial or aquatic areas restored
- Terrestrial or aquatic areas under sustainable management
- Atmospheric areas benefitting from reduced air pollution from energy generation, industries, transport, solid waste, indoor cooking and/or heating, and agriculture
- Terrestrial or aquatic areas benefitting from reduced pollution including through reduced waste generation and the application of circular economy principles.
Other notes:
“Atmospheric area” or an airshed is a common geographic area where pollutants get trapped, and create a similar air quality for everyone. (World Bank Group. 2021. Beyond Boundaries – Understanding Airsheds and PM2.5. Video. 7 September)
“Sustainable management” includes sustainable use that safeguards ecosystem goods and services, and minimizes adverse environmental effects.
Exclusions: Area benefitting from any of the above activities undertaken as required by the ADB Safeguard Policy Statement to mitigate or offset the impact of ADB investment
Available data disaggregation: Operation, country, subregion, fund source
Performance measurement: Achievement rate
Data sources: Annual ADB data (expected and actual results taken from the latest approved DMF as reflected in project PCRs, TCRs, XARRs, and RRPs)
PROSPERITY
- 1.5 million
jobs directly generated (DR10)
Results Achieved1,456,000
Achievement Rate (%)100+
Definition
Calculations:
Number: The total number of jobs created directly under ADB-supported projects.
Achievement rate: Calculated using the ratio of the aggregate amount of results reported in project completion reports (PCR), technical assistance completion reports (TCR) or extended annual review reports (XARR) published in the reporting year (numerator), as having been achieved by ADB-supported operations to the planned results as reported in reports and recommendations of the President (RRP) for the same operations (denominator).
Definition:
“Jobs” refer to activities that generate income, monetary or in kind, and follow standards of decent work as defined by the International Labour Organization.
“Jobs created directly” refer to employment directly for an employer and paid directly by that employer. For the purpose of this indicator, short- and long-term, part- and full-time jobs are counted and reported.
Available data disaggregation: Sex, operation, country, subregion, fund source
Performance measurement: Achievement rate
Data source: Annual ADB data (expected and actual results taken from the latest approved DMF as reflected in project PCRs, TCRs, XARRs, and RRPs)
- 67,000
entities with improved service delivery and/or financial stability (DR11)
Results Achieved67,000
Achievement Rate (%)100
Definition
Calculations:
Number: Total number of private and public entities that demonstrated evidence of improved service delivery and financial management under ADB supported operations.
Achievement rate: Calculated using the ratio of the aggregate amount of results reported in project completion reports (PCR), technical assistance completion reports (TCR) or extended annual review reports (XARR) published in the reporting year (numerator), as having been achieved by ADB-supported operations to the planned results as reported in reports and recommendations of the President (RRP) for the same operations (denominator).
Definition:
Entities may be any national and subnational government, department, agency, a special purpose district or province, as well as private entities. Private entities include broadly private sector companies.
Improvement is measured by institutional strengthening in the following areas:
- Macroeconomic and fiscal stability, debt sustainability, banking (e.g., financial regulation and supervision), and capital markets: Entities would have built fiscal space to manage shocks through policies that relate to expenditure, revenue, debt, and fiscal balance as well as policies focused on broadening the economic base.
- Public financial management: Entities would have improved relevant performance measures, such as increasing the “budget execution rate,” ensuring “prompt reconciliation of bank balances through Treasury Single Account system,” or improving the “timeliness of the release of semiannual budget reports on available media.”
- Tax policy and administration: Entities would have improved relevant performance measures, such as increasing “the number of registered taxpayers,” reducing “custom clearance times,” or improving “client perception of tax administration.”
- Civil service and public administration: Entities would have improved relevant performance measures, such as increasing the “share of merit-based appointments,” reducing the “time for key services and administrative processes,” or increasing the “percentage of the population reporting satisfaction with central government services.”
- Procurement: Entities would have improved relevant performance measures, such as reducing “average procurement processing times,” publishing “financial and procurement processes and documents on various media sources,” or improving “transparency and reduced transaction costs (e.g., time) for public procurement.”
- Financial stability: Entities would have improved relevant performance measures, such as finance sector’s vulnerability to shocks, soundness, and funding methods, the degree of adherence to international principles, e.g., Basel Core Principles, and the quality of risk management and supervision.
- Legal and judicial systems: Entities would have improved performance measures, such as improved legal and regulatory framework, predictable legal environment, effective enforcement of laws and contracts, independent, impartial and competent judges, increased access to justice, reduced backlog of cases in courts, availability of alternative dispute resolution mechanisms, increased public confidence.
- Other public and private services that are delivered through public and private entities, state-owned enterprises, and public–private partnerships (PPPs).
Public and quasi-public services need to be delivered with integrity, centered around citizens, and responsive to their needs, particularly the needs of the most vulnerable. Promoting greater transparency and enabling ordinary citizens to assess the quality, adequacy, and effectiveness of basic services, to voice their needs and preferences and to become involved in innovation offers an opportunity to enable better use of public funds and improve service delivery.
Other notes:
For purposes of this indicator, only those entities which have substantially achieved (at least 90% of target) a relevant outcome indicator in the DMF which measures improvement based on sector-specific standards are counted.
Where cases of double-counting can be identified, the same entities benefiting from improvements in more than one area under different ADB projects will only be counted once.
Available data disaggregation: Operation, country, subregion, fund source
Performance measurement: Achievement rate
Data sources: Annual ADB data (expected and actual results taken from the latest approved DMF as reflected in project PCRs, TCRs, XARRs, and RRPs)
- $164.5 billion
in trade and investment facilitated (DR12)
Results Achieved164,482,200,000
Achievement Rate (%)100+
Definition
Calculations:
Value: Total value of goods, services, and foreign direct investment that crossed borders facilitated by ADB operations.
Achievement rate: is calculated using the ratio of the aggregate amount of results reported in project completion reports (PCR), technical assistance completion reports (TCR) or extended annual review reports (XARR) published in the reporting year, as having been achieved by ADB-supported operations to the planned results as reported in reports and recommendations of the President (RRP) for the same operations.
Definition:
Results from ADB operations classified as regional cooperation and integration that contributed to (i) implementation of existing and new regional trade, investment, and financial cooperation agreements; (ii) a reduction in the compliance cost in terms of time and documentation for improved cross-border trade and investment; (iii) new or upgraded regional connectivity or improved capacity for cross-border energy trade; and/or (iv) the improvement or expansion of multisector economic corridors will be used for this indicator.
Other notes:
In cases where the volume (in units) of goods and services is reported for applicable operations, calculation of their dollar value will be done based on the average cost of the relevant unit of goods and services in the reporting period. Conversion of local currency to dollar value will be done based on the official currency exchange rate as of 31 December of the calendar year.
Available data disaggregation: Operation, country, subregion, fund source
Performance measurement: Achievement rate
Data source: Annual ADB data (expected and actual results taken from the latest approved DMF as reflected in project PCRs, TCRs, XARRs, and RRPs); Trade and Supply Chain Finance Program (TSCFP)
ADF
People
- 2.4 million
poor and vulnerable people with improved living standards (DR1)
Results Achieved2,362,000
Achievement Rate (%)100+
Definition
Calculations:
Number:
Total number of people in poverty and/or in vulnerable situations benefiting from improved standards of living under ADB projects.
Achievement rate:
Calculated using the ratio of the aggregate amount of results reported in project completion reports (PCR), technical assistance completion reports (TCR) or extended annual review reports (XARR) published in the reporting year (numerator), as having been achieved by ADB-supported operations to the planned results as reported in reports and recommendations of the President (RRP) for the same operations (denominator).
Definitions:
“People in poverty” are those from households living on less than $2.15 a day using 2017 prices.
“People in vulnerable situations” refers to (as relevant for a particular project) people who by virtue of their age, sex, gender, sexual orientation and gender identity, ethnicity, religion, disability, social and civic or health status, economic disadvantage or indigenous status, and/or dependence on unique natural resources, may be more limited than others in their ability to and/or excluded from/unable to participate fully in benefit sharing.
“Improved standards of living” refer to improved access to basic infrastructure and services (social and economic), which are:
- Benefits from improved infrastructure services by the poor and vulnerable, including:
- Use of roads and bridges constructed or upgraded
- Use of transportation systems constructed or improved
- Use of electricity, sewerage, water, sanitation, and solid waste management facilities constructed or improved
- Use of flood-control facilities constructed, and flood forecasting and warning systems established
- Use of subsidized or low-cost housing and shelter constructed
- Use of other improved services as set out in the DMF.
- Benefits from improved financial services by the poor and vulnerable, including:
- Transaction accounts opened to enable people to easily receive government benefits (pensions, aid, and cash) through electronic payments
- Secure and convenient access to credit, savings, and insurance
- Improved access to finance and e-commerce opportunities for micro, small, and medium-sized enterprises using their digital footprints.
- Other improvements in standards of living as set out in the DMF.
Other notes:
Effect of ADB projects on poor and vulnerable individuals may be estimated based on coverage area and available census data on poverty and vulnerability incidence in the project area, or other relevant estimated methodology. Sex-disaggregation may be estimated from the household data, based on average household composition.
Where cases of double-counting can be identified, the same individual benefiting from improved infrastructure and financial services under different ADB projects will only be counted once.
Available data disaggregation: Sex, age, disabilities, operation, country, subregion, fund source
Performance measurement: Achievement rate
Data source: Annual ADB data (expected and actual results taken from the latest approved DMF as reflected in project PCRs, TCRs, XARRs, and RRPs)
- 33,000
people benefiting from improved health and education services, and social protection (DR2)
Results Achieved33,000
Achievement Rate (%)71
Definition
Calculations:
Number: Total number of people benefitting from improved health services, education services, or social protection provided under ADB projects.
Achievement rate: Calculated using the ratio of the aggregate amount of results reported in project completion reports (PCR), technical assistance completion reports (TCR) or extended annual review reports (XARR) published in the reporting year (numerator), as having been achieved by ADB-supported operations to the planned results as reported in reports and recommendations of the President (RRP) for the same operations (denominator).
Definitions:
Health services include those identified by DMCs as part of their essential or basic health services, or their national health insurance basic benefit package. The identification by DMCs can be through a formal policy statement or, in the absence of a formal policy statement, a written confirmation by senior government health officials.
“Improved health services” refer to those with improved quality including to prevent, detect, and respond to health emergencies, and/or expanded geographical, physical, and financial access including through the establishment of health facilities with ADB support. “Increased quality of health services” will be determined on a project or country basis.
“Establishment of health facilities” refers to the construction or upgrading of hospitals, health centers, and other facilities that provide health services.
“Benefit from improved health services” refers to actual use of better-quality health services, such as people hospitalized with health insurance coverage, mothers delivering babies in new hospitals, and children vaccinated in new urban health centers, all with ADB support.
“Improved education services” refers to all levels of education including preprimary, primary, secondary, tertiary, formal technical and vocational education, non-formal education such as training, life-long learning, re- and up-skilling, and industry-run academies, and higher education, that have introduced reforms to improve the learning outcomes or employability of those enrolled.
“Benefit from improved education services” refers to:
- Students educated under improved quality assurance systems
- Teachers trained with quality or improved competency standards
- Students using new or improved education facilities
- Professional training e.g. doctors, nurses, engineers, technicians trained under improved standards
- Other relevant education and training enrollment as indicated in project DMF.
Social protection refers to a set of policies and programs designed to reduce poverty and vulnerability by promoting labor market functioning, diminishing people’s exposure to risks and enhancing their capacity to protect themselves against hazards and the interruption or loss of income.
Social assistance refers to publicly funded transfers and services for the most vulnerable groups with no other means of adequate support. Examples include welfare assistance (e.g., cash or in-kind transfer and social care services), social pensions, child grants, and other universal programs, health assistance, and disability benefits.
Social insurance pertains to contributory schemes to cushion the risks associated with old age, health, disability, work injury, and unemployment. Examples include pensions, health insurance, other social insurance such as unemployment and disability insurance, maternity benefits, benefits from provident funds.
Labor market policies and programs are designed to facilitate employment and to promote the efficient operation of the labor markets. Examples include skills development and training, public works programs such as cash-for-work or food-for-work, and core labor standards.
“Benefit from improved social protection” refers to individuals receiving social assistance (and all members of a household when assistance is household-based), or registered under any social insurance scheme, or participating in any active labor market program.
Other notes:
Total number of individuals may be estimated based on coverage area or other relevant estimated methodology. Sex-disaggregation may be estimated from the household data, based on average household composition.
Where cases of double-counting can be identified, the same individual benefiting from improved health and education services and/or social protection under different ADB projects will only be counted once.
Available data disaggregation: Sex, age, disabilities, operation, country, subregion, fund source
Performance measurement: Achievement rate
Data source: Annual ADB data (expected and actual results taken from the latest approved DMF as reflected in project PCRs, TCRs, XARRs, and RRPs)
- 7.1 million
people benefiting from improved infrastructure, financial, and economic services (DR3)
Results Achieved7,053,000
Achievement Rate (%)100+
Definition
Calculations:
Number: Total number of people benefiting from improved services under ADB projects.
Achievement rate: Calculated using the ratio of the aggregate amount of results reported in project completion reports (PCR), technical assistance completion reports (TCR) or extended annual review reports (XARR) published in the reporting year (numerator), as having been achieved by ADB-supported operations to the planned results as reported in reports and recommendations of the President (RRP) for the same operations (denominator).
Definitions:
“Improved services” refer to:
Infrastructure services including:
- Roads and bridges constructed or upgraded
- Electricity, sewerage, water, sanitation, and solid waste management facilities
- Telecommunications and information and communication technology
- Flood-control facilities constructed, and flood forecasting and warning systems established
- Low-cost housing constructed
- Other improved infrastructure services as indicated in the DMF.
Financial services including:
- Secure and convenient access to credit, savings, and insurance
- Improved access to finance and e-commerce opportunities for micro, small, and medium-sized enterprises
- Other improved financial services as indicated in the DMF.
Economic services including:
- Agro-processing facilities and services
- Marketing (wholesale and retail)
- Transport and distribution facilities and service
- Agricultural and other livelihood training
- Other economic services as indicated in the DMF.
Other notes:
The same individual benefiting from improvements in more than one services under different ADB projects will only be counted once, where cases of double-counting are identified. An improvement in services will be determined by comparison of post-project quality, access and reliability as defined in a DMF for a relevant project, with a baseline at the start of the project.
Total number of individuals may be estimated based on the coverage area. Sex-disaggregation may be estimated from the household data, based on average household composition. This indicator is a subset of development results indicator number 1.
Available data disaggregation: Sex, operation, country, subregion, fund source
Performance measurement: Achievement rate
Data source: Annual ADB data (expected and actual results taken from the latest approved DMF as reflected in project PCRs, TCRs, XARRs, and RRPs)
- 114,000
women and girls benefiting from greater gender equality (DR4)
Results Achieved114,000
Achievement Rate (%)100
Definition
Calculations:
Number: Total number of women and girls with (i) increased economic empowerment (e.g., access to finance and access to financial skills); (ii) benefiting from transformative gender equality initiatives (e.g., with improved time savings, access to gender-based violence (GBV) services, access to healthcare services addressing sexual and reproductive health and rights (SRHR), and leadership and decision making).
Achievement rate: Calculated using the ratio of the aggregate amount of results reported in project completion reports (PCR), technical assistance completion reports (TCR) or extended annual review reports (XARR) published in the reporting year (numerator), as having been achieved by ADB-supported operations to the planned results as reported in reports and recommendations of the President (RRP) for the same operations (denominator).
Other notes:
Where cases of double-counting can be identified, the same individual benefiting from improvements in more than one area under different ADB projects will only be counted once.
Total number of individuals may be estimated based on the coverage area.
Available data disaggregation: Operation, country, subregion, financing
Performance measurement: Achievement rate
Data source: Annual ADB data (expected and actual results taken from the latest approved DMF as reflected in project PCRs, TCRs, XARRs, and RRPs)
Planet
- 764,000
tCO₂e/year in reduced greenhouse gas emissions (DR5)
Results Achieved764,000
Achievement Rate (%)20
Definition
Calculations:
Net emissions: The total net carbon dioxide equivalent emission avoided as a result of ADB projects or components of projects. A baseline will be established to determine the emissions that would have occurred in the absence of the project. This involves calculating the GHG emissions from the existing situation or the scenario before the project’s implementation. Then GHG emissions resulting from the project itself will be calculated as well. The avoided emissions are the difference between the baseline emissions and the project emissions.
Achievement rate: calculated using the ratio of the aggregate amount of results reported in project completion reports (PCR), technical assistance completion reports (TCR) or extended annual review reports (XARR) published in the reporting year (numerator), as having been achieved by ADB-supported operations to the planned results as reported in reports and recommendations of the President (RRP) for the same operations (denominator).
Other notes:
Calculations for greenhouse gas reduction will be guided by ADB’s Guidelines for Estimating Greenhouse Gas Emissions as updated from time to time, as well as other internationally recognized methodologies.
Available data disaggregation: Operation, country, subregion, fund source
Performance measurement: Achievement rate
Data source: Annual ADB data (expected and actual results taken from the latest approved DMF as reflected in project PCRs, TCRs, XARRs, and RRPs)
No results available
- 1,500 megawatts
renewable energy capacity installed (DR6)
Results Achieved0
Achievement Rate (%)Not applicable
Definition
Calculations:
Energy capacity: The total additional capacity in megawatts (MW) resulting from generation projects using renewable energy sources.
Achievement rate: Calculated using the ratio of the aggregate amount of results reported in project completion reports (PCR), technical assistance completion reports (TCR) or extended annual review reports (XARR) published in the reporting year (numerator), as having been achieved by ADB-supported operations to the planned results as reported in reports and recommendations of the President (RRP) for the same operations (denominator).
Definition:
Installed energy generation capacity from a renewable energy project is the rated capacity of a project or project component involving renewable energy technologies, such as solar, wind, small or mini hydro, geothermal, and biomass. The project may be either new construction or acquisition (e.g., acquisition of a government-owned small hydro plant by the private sector).
Available data disaggregation: Operation, country, subregion, fund source
Performance measurement: Achievement rate
Data sources: Annual ADB data (expected and actual results taken from the latest approved DMF as reflected in project PCRs, TCRs, XARRs, and RRPs)
- 252,000
people with strengthened climate and disaster resilience (DR7)
Results Achieved252,000
Achievement Rate (%)100+
Definition
Calculations:
Number: Total number of individuals who benefit from strengthened climate and disaster resilience under ADB projects.
Achievement rate: Calculated using the ratio of the aggregate amount of results reported in project completion reports (PCR), technical assistance completion reports (TCR) or extended annual review reports (XARR) published in the reporting year (numerator), as having been achieved by ADB-supported operations to the planned results as reported in reports and recommendations of the President (RRP) for the same operations (denominator).
Definition:
Strengthened climate and disaster resilience is the enhanced ability of an individual to resist, absorb, recover from, and reorganize in response to climate and disaster-related shocks and stresses, without jeopardizing their sustained socioeconomic development.
The benefits of ADB projects counted for the purpose of this indicator include:
- Use of retrofitted or new disaster-resilient facilities (e.g., housing, educational facilities, health care facilities, government offices)
- Use of stored water during periods of drought
- Reduced exposure to flooding
- Use of improved early warning information
- Financial protection against disaster damage and loss
- Use of new disaster risk management knowledge and skills (e.g., in livelihood decisions)
- Use of knowledge, skills, and competences on climate mitigation, adaptation, disaster risk, and early warning.
The number of people protected by contingent disaster financing, sovereign or subsovereign parametric insurance products, catastrophe bonds, and resilience bonds should be based on the total number of people in the relevant country affected by disasters over the past 20 years divided by the number of reported events (or, for subsovereign products, the total number of people in the subsovereign entity affected by disasters over the past 20 years divided by the number of reported events in that entity).
Other notes:
Where cases of double-counting can be identified, the same individual benefiting from improvements in more than one area under different ADB projects will only be counted once.
Total number of individuals may be estimated based on the coverage area. Sex-disaggregation may be estimated from the household data, based on average household composition.
Available data disaggregation: Sex, operation, country, subregion, fund source
Performance measurement: Achievement rate
Data source: Annual ADB data (expected and actual results taken from the latest approved DMF as reflected in project PCRs, TCRs, XARRs, and RRPs)
- 21.7 million
people with strengthened food and nutrition security (DR8)
Results Achieved587,000
Achievement Rate (%)Not applicable
Definition
Calculations:
Number: Total number of individuals who benefit from strengthened food and nutrition security under ADB projects.
Achievement rate: Calculated using the ratio of the aggregate amount of results reported in project completion reports (PCR), technical assistance completion reports (TCR) or extended annual review reports (XARR) published in the reporting year (numerator), as having been achieved by ADB-supported operations to the planned results as reported in reports and recommendations of the President (RRP) for the same operations (denominator).
Definition:
Operations across multiple sectors that strengthen food security may refer to interventions that may span the universally accepted dimensions of food security, including the availability of food, access to food, utilization of food and the stability of food systems. Examples of such interventions could include operations which relate directly to food production and consumption, such as climate resilient agriculture and food systems; social protection/social safety nets; nutrition services; supply chain, financial and trade finance operations that support food inputs, imports, and distribution of food, etc.; increase the income of small-scale food producers; water for agriculture; agricultural services, improved practices and technologies; integration of (smallholder) farmers to markets.
Food security is defined when all people, at all times, have physical and economic access to sufficient safe and nutritious food that meets their dietary needs and food preferences for an active and healthy life.
Other notes:
Where cases of double-counting can be identified, the same individual benefiting from improvements in more than one area under different ADB projects will only be counted once.
Available data disaggregation: Sex, operation, country, subregion, fund source
Performance measurement: Achievement rate
Data source: Annual ADB data (expected and actual results taken from the latest approved DMF as reflected in project PCRs, TCRs, XARRs, and RRPs)
- 377,000
hectares of land conserved, restored, enhanced, and/or under sustainable management (DR9)
Results Achieved377,000
Achievement Rate (%)19
Definition
Calculations:
Areas: Total hectares of terrestrial, aquatic, and atmospheric areas conserved, restored, enhanced and/or under sustainable management under ADB projects.
Achievement rate: Calculated using the ratio of the aggregate amount of results reported in project completion reports (PCR), technical assistance completion reports (TCR) or extended annual review reports (XARR) published in the reporting year (numerator), as having been achieved by ADB-supported operations to the planned results as reported in reports and recommendations of the President (RRP) for the same operations (denominator).
Definition:
This includes the area of:
- Terrestrial or aquatic protected areas newly created or under improved management effectiveness
- Terrestrial or aquatic areas restored
- Terrestrial or aquatic areas under sustainable management
- Atmospheric areas benefitting from reduced air pollution from energy generation, industries, transport, solid waste, indoor cooking and/or heating, and agriculture
- Terrestrial or aquatic areas benefitting from reduced pollution including through reduced waste generation and the application of circular economy principles.
Other notes:
“Atmospheric area” or an airshed is a common geographic area where pollutants get trapped, and create a similar air quality for everyone. (World Bank Group. 2021. Beyond Boundaries – Understanding Airsheds and PM2.5. Video. 7 September)
“Sustainable management” includes sustainable use that safeguards ecosystem goods and services, and minimizes adverse environmental effects.
Exclusions: Area benefitting from any of the above activities undertaken as required by the ADB Safeguard Policy Statement to mitigate or offset the impact of ADB investment
Available data disaggregation: Operation, country, subregion, fund source
Performance measurement: Achievement rate
Data sources: Annual ADB data (expected and actual results taken from the latest approved DMF as reflected in project PCRs, TCRs, XARRs, and RRPs)
PROSPERITY
- 16,000
jobs directly generated (DR10)
Results Achieved16,000
Achievement Rate (%)Not applicable
Definition
Calculations:
Number: The total number of jobs created directly under ADB-supported projects.
Achievement rate: Calculated using the ratio of the aggregate amount of results reported in project completion reports (PCR), technical assistance completion reports (TCR) or extended annual review reports (XARR) published in the reporting year (numerator), as having been achieved by ADB-supported operations to the planned results as reported in reports and recommendations of the President (RRP) for the same operations (denominator).
Definition:
“Jobs” refer to activities that generate income, monetary or in kind, and follow standards of decent work as defined by the International Labour Organization.
“Jobs created directly” refer to employment directly for an employer and paid directly by that employer. For the purpose of this indicator, short- and long-term, part- and full-time jobs are counted and reported.
Available data disaggregation: Sex, operation, country, subregion, fund source
Performance measurement: Achievement rate
Data source: Annual ADB data (expected and actual results taken from the latest approved DMF as reflected in project PCRs, TCRs, XARRs, and RRPs)
- 410
entities with improved service delivery and/or financial stability (DR11)
Results Achieved410
Achievement Rate (%)100
Definition
Calculations:
Number: Total number of private and public entities that demonstrated evidence of improved service delivery and financial management under ADB supported operations.
Achievement rate: Calculated using the ratio of the aggregate amount of results reported in project completion reports (PCR), technical assistance completion reports (TCR) or extended annual review reports (XARR) published in the reporting year (numerator), as having been achieved by ADB-supported operations to the planned results as reported in reports and recommendations of the President (RRP) for the same operations (denominator).
Definition:
Entities may be any national and subnational government, department, agency, a special purpose district or province, as well as private entities. Private entities include broadly private sector companies.
Improvement is measured by institutional strengthening in the following areas:
- Macroeconomic and fiscal stability, debt sustainability, banking (e.g., financial regulation and supervision), and capital markets: Entities would have built fiscal space to manage shocks through policies that relate to expenditure, revenue, debt, and fiscal balance as well as policies focused on broadening the economic base.
- Public financial management: Entities would have improved relevant performance measures, such as increasing the “budget execution rate,” ensuring “prompt reconciliation of bank balances through Treasury Single Account system,” or improving the “timeliness of the release of semiannual budget reports on available media.”
- Tax policy and administration: Entities would have improved relevant performance measures, such as increasing “the number of registered taxpayers,” reducing “custom clearance times,” or improving “client perception of tax administration.”
- Civil service and public administration: Entities would have improved relevant performance measures, such as increasing the “share of merit-based appointments,” reducing the “time for key services and administrative processes,” or increasing the “percentage of the population reporting satisfaction with central government services.”
- Procurement: Entities would have improved relevant performance measures, such as reducing “average procurement processing times,” publishing “financial and procurement processes and documents on various media sources,” or improving “transparency and reduced transaction costs (e.g., time) for public procurement.”
- Financial stability: Entities would have improved relevant performance measures, such as finance sector’s vulnerability to shocks, soundness, and funding methods, the degree of adherence to international principles, e.g., Basel Core Principles, and the quality of risk management and supervision.
- Legal and judicial systems: Entities would have improved performance measures, such as improved legal and regulatory framework, predictable legal environment, effective enforcement of laws and contracts, independent, impartial and competent judges, increased access to justice, reduced backlog of cases in courts, availability of alternative dispute resolution mechanisms, increased public confidence.
- Other public and private services that are delivered through public and private entities, state-owned enterprises, and public–private partnerships (PPPs).
Public and quasi-public services need to be delivered with integrity, centered around citizens, and responsive to their needs, particularly the needs of the most vulnerable. Promoting greater transparency and enabling ordinary citizens to assess the quality, adequacy, and effectiveness of basic services, to voice their needs and preferences and to become involved in innovation offers an opportunity to enable better use of public funds and improve service delivery.
Other notes:
For purposes of this indicator, only those entities which have substantially achieved (at least 90% of target) a relevant outcome indicator in the DMF which measures improvement based on sector-specific standards are counted.
Where cases of double-counting can be identified, the same entities benefiting from improvements in more than one area under different ADB projects will only be counted once.
Available data disaggregation: Operation, country, subregion, fund source
Performance measurement: Achievement rate
Data sources: Annual ADB data (expected and actual results taken from the latest approved DMF as reflected in project PCRs, TCRs, XARRs, and RRPs)
- $7.4 billion
in trade and investment facilitated (DR12)
Results Achieved7,420,000,000
Achievement Rate (%)100+
Definition
Calculations:
Value: Total value of goods, services, and foreign direct investment that crossed borders facilitated by ADB operations.
Achievement rate: is calculated using the ratio of the aggregate amount of results reported in project completion reports (PCR), technical assistance completion reports (TCR) or extended annual review reports (XARR) published in the reporting year, as having been achieved by ADB-supported operations to the planned results as reported in reports and recommendations of the President (RRP) for the same operations.
Definition:
Results from ADB operations classified as regional cooperation and integration that contributed to (i) implementation of existing and new regional trade, investment, and financial cooperation agreements; (ii) a reduction in the compliance cost in terms of time and documentation for improved cross-border trade and investment; (iii) new or upgraded regional connectivity or improved capacity for cross-border energy trade; and/or (iv) the improvement or expansion of multisector economic corridors will be used for this indicator.
Other notes:
In cases where the volume (in units) of goods and services is reported for applicable operations, calculation of their dollar value will be done based on the average cost of the relevant unit of goods and services in the reporting period. Conversion of local currency to dollar value will be done based on the official currency exchange rate as of 31 December of the calendar year.
Available data disaggregation: Operation, country, subregion, fund source
Performance measurement: Achievement rate
Data source: Annual ADB data (expected and actual results taken from the latest approved DMF as reflected in project PCRs, TCRs, XARRs, and RRPs); Trade and Supply Chain Finance Program (TSCFP)
Quality of Completed Operations
ADB Overall
- 2025 ADB: 69
Definition
Calculation:
Number of project completion report (PCR) validation reports prepared by the Independent Evaluation Department (IED) with successful or highly successful ratings in the last 3 reporting years (numerator), as a percentage of the total number of PCR validation reports prepared for PCRs circulated during the same period (denominator).
Definition:
The overall success rating of a sovereign operation is based on the assessments of (i) relevance, (ii) effectiveness, (iii) efficiency, and (iv) sustainability.
Other notes:
Where available, project performance evaluation report (PPER) ratings are taken as the final rating. If no PPER has been prepared, the PCR validation report rating is used.
Only the ratings by IED are counted.
Reporting year is from July 1 of the previous year to June 30 of the current calendar year.
Available data disaggregation: Criteria, operations, and country (reporting as tracking indicators); fund source
Performance measurement: Point target, 3-year rolling basis
Data source: Annual ADB data (Independent Evaluation Department’s validation of PCRs and PPERs)
- 2025 ADB: 56
Definition
Calculation:
Number of extended annual review report (XARR) validation reports prepared by IED with successful or highly successful ratings in the last 3 reporting years (numerator), as a percentage of the total number of XARR validation reports prepared for XARRs circulated during the same period (denominator).
Definition:
Overall ratings of the NSO project is derived from the ratings applied to the four criteria:
- Development results, which comprises four sub-criteria: (a) contribution to private sector development and ADB strategic objectives; (b) economic performance; (c) environment, social, health, and safety performance; and (d) business success
- ADB’s additionality
- ADB’s investment profitability
- ADB work quality
Other notes:
Where available, PPER ratings are taken as the final rating. If no PPER has been prepared, the XARR validation report ratings are taken as the final rating.
Only the ratings by IED are counted.
Reporting year is from July 1 of the previous year to June 30 of the current calendar year.
Available data disaggregation: Operations, criteria (both reporting as tracking indicators); fund source
Performance measurement: Point target, 3-year rolling basis
Data source: Annual ADB data (Independent Evaluation Department’s validation of XARRs and PPERs)
- 2025 ADB: 86
Definition
Calculation:
Number of project completion reports (PCRs) and extended annual review reports (XARRs) categorized as having gender equality objective (GEN) or effective gender mainstreaming (EGM), that achieved their intended gender equality results at the outcome (if relevant) and output levels as reflected in the gender performance indicators included in the DMF, gender assessment and action plan (GAAP), and any other relevant monitoring framework* during the last 3 reporting years (numerator), as a percentage of total number of PCRs and XARRs of operations categorized as GEN or EGM during the same period (denominator).
Definition:
The assessment of whether an operation has delivered the intended gender results is based on (i) reported results using sex-disaggregated data; (ii) reported successful achievement of gender performance indicators (measured as completion of at least 80% of activities, targets, policy actions) in the project or program gender action plan**; and (iii) justification as to why the gender equality results are considered achieved if an overall PCR or XARR rating is less than successful or unsuccessful.
*This refers to monitoring frameworks that may be developed for the purpose of any new modality, such as the gender monitoring matrix (GMM) which was applied for CPROs.
**All project or program gender performance indicators (e.g., in the DMF) must be reflected in the GAP. For sovereign programs (e.g., PBLs and RBLs) which do not have a GAP, the assessment of gender results will be based on the Policy DMF or any other relevant monitoring framework for that modality.
Other notes:
See forthcoming guidelines for the “At-Exit Assessment of Gender Equality Results of ADB Projects.”
Reporting year is from July 1 of the previous year to June 30 of the current calendar year.
Available data disaggregation: Fund source
Performance measurement: Point target, 3-year rolling basis
Data sources: Annual ADB data (Climate Change and Sustainable Development Department; Sovereign Operations system)
- 2025 ADB: Not applicable
Definition
Calculation:
Average rating given by all survey respondents to the client perception survey question: “Overall, please rate the usefulness of ADB’s knowledge products and services” (KPS) (based on a 5-point scale with 1 being lowest and 5 being highest). The average rating is converted to percentage, where an average rating of 5 is equivalent to 100%.
Definition:
KPS are knowledge-rich content and activities that enable, facilitate, or support decisions or actions by intended users. These include flagships, technical studies, working papers, policy briefs, op-eds, and other KPS formats that are monitored through department and staff work programs.
Other notes:
A survey is conducted every 2 years among ADB developing member countries to assess the reach, quality, and utilization of ADB’s KPS.
The survey respondents include (i) primary clients including government agencies and private sector entities in ADB developing member countries that have taken part in ADB-financed operations; and (ii) non-primary clients including academic, research institutions, think tanks, and media.
Available data disaggregation: Respondents
Performance measurement: Periodic performance target
Data source: Biennial Client Perception Survey Report of Department of Communications and Knowledge Management
ADF
- 2025 ADF: 70
Definition
Calculation:
Number of project completion report (PCR) validation reports prepared by the Independent Evaluation Department (IED) with successful or highly successful ratings in the last 3 reporting years (numerator), as a percentage of the total number of PCR validation reports prepared for PCRs circulated during the same period (denominator).
Definition:
The overall success rating of a sovereign operation is based on the assessments of (i) relevance, (ii) effectiveness, (iii) efficiency, and (iv) sustainability.
Other notes:
Where available, project performance evaluation report (PPER) ratings are taken as the final rating. If no PPER has been prepared, the PCR validation report rating is used.
Only the ratings by IED are counted.
Reporting year is from July 1 of the previous year to June 30 of the current calendar year.
Available data disaggregation: Criteria, operations, and country (reporting as tracking indicators); fund source
Performance measurement: Point target, 3-year rolling basis
Data source: Annual ADB data (Independent Evaluation Department’s validation of PCRs and PPERs)
No results available
- 2025 ADF: Not applicable
Definition
Calculation:
Number of extended annual review report (XARR) validation reports prepared by IED with successful or highly successful ratings in the last 3 reporting years (numerator), as a percentage of the total number of XARR validation reports prepared for XARRs circulated during the same period (denominator).
Definition:
Overall ratings of the NSO project is derived from the ratings applied to the four criteria:
- Development results, which comprises four sub-criteria: (a) contribution to private sector development and ADB strategic objectives; (b) economic performance; (c) environment, social, health, and safety performance; and (d) business success
- ADB’s additionality
- ADB’s investment profitability
- ADB work quality
Other notes:
Where available, PPER ratings are taken as the final rating. If no PPER has been prepared, the XARR validation report ratings are taken as the final rating.
Only the ratings by IED are counted.
Reporting year is from July 1 of the previous year to June 30 of the current calendar year.
Available data disaggregation: Operations, criteria (both reporting as tracking indicators); fund source
Performance measurement: Point target, 3-year rolling basis
Data source: Annual ADB data (Independent Evaluation Department’s validation of XARRs and PPERs)
- 2025 ADF: 88
Definition
Calculation:
Number of project completion reports (PCRs) and extended annual review reports (XARRs) categorized as having gender equality objective (GEN) or effective gender mainstreaming (EGM), that achieved their intended gender equality results at the outcome (if relevant) and output levels as reflected in the gender performance indicators included in the DMF, gender assessment and action plan (GAAP), and any other relevant monitoring framework* during the last 3 reporting years (numerator), as a percentage of total number of PCRs and XARRs of operations categorized as GEN or EGM during the same period (denominator).
Definition:
The assessment of whether an operation has delivered the intended gender results is based on (i) reported results using sex-disaggregated data; (ii) reported successful achievement of gender performance indicators (measured as completion of at least 80% of activities, targets, policy actions) in the project or program gender action plan**; and (iii) justification as to why the gender equality results are considered achieved if an overall PCR or XARR rating is less than successful or unsuccessful.
*This refers to monitoring frameworks that may be developed for the purpose of any new modality, such as the gender monitoring matrix (GMM) which was applied for CPROs.
**All project or program gender performance indicators (e.g., in the DMF) must be reflected in the GAP. For sovereign programs (e.g., PBLs and RBLs) which do not have a GAP, the assessment of gender results will be based on the Policy DMF or any other relevant monitoring framework for that modality.
Other notes:
See forthcoming guidelines for the “At-Exit Assessment of Gender Equality Results of ADB Projects.”
Reporting year is from July 1 of the previous year to June 30 of the current calendar year.
Available data disaggregation: Fund source
Performance measurement: Point target, 3-year rolling basis
Data sources: Annual ADB data (Climate Change and Sustainable Development Department; Sovereign Operations system)
No results available
- 2025 ADF: Not applicable
Definition
Calculation:
Average rating given by all survey respondents to the client perception survey question: “Overall, please rate the usefulness of ADB’s knowledge products and services” (KPS) (based on a 5-point scale with 1 being lowest and 5 being highest). The average rating is converted to percentage, where an average rating of 5 is equivalent to 100%.
Definition:
KPS are knowledge-rich content and activities that enable, facilitate, or support decisions or actions by intended users. These include flagships, technical studies, working papers, policy briefs, op-eds, and other KPS formats that are monitored through department and staff work programs.
Other notes:
A survey is conducted every 2 years among ADB developing member countries to assess the reach, quality, and utilization of ADB’s KPS.
The survey respondents include (i) primary clients including government agencies and private sector entities in ADB developing member countries that have taken part in ADB-financed operations; and (ii) non-primary clients including academic, research institutions, think tanks, and media.
Available data disaggregation: Respondents
Performance measurement: Periodic performance target
Data source: Biennial Client Perception Survey Report of Department of Communications and Knowledge Management
Strategic Alignment
ADB Overall
- 2025 ADB: 51
Definition
Calculation:
Annual volume, in $ amount, of committed sovereign and nonsovereign ADB operations supporting climate change mitigation and/or adaptation (numerator), expressed as a percentage of total ADB operations committed in the given year (numerator).
Other notes:
Inclusion: Financing from ADB ordinary and concessional capital resources and Asian Development Fund.
Exclusions: Cofinancing, investment facilities, private sector programs, technical assistance, transaction advisory services, and loans and grants supporting project preparation and design activities.
Available data disaggregation: Activities (mitigation, adaptation, both), and fund source, both reporting as tracking indicators
Performance measurement: Point target
Data source: Annual ADB data (Climate Change and Sustainable Development Department; Private Sector Operations Department; Regional Departments; Sectors Group; Sovereign Operations system)
- 2025 ADB: 35
Definition
Calculation:
Number of sovereign and nonsovereign operations committed that support disaster risk management, and environment and nature (numerator), as a percentage of the total number of sovereign and nonsovereign operations committed in the given year (denominator).
Definition:
An operation can be classified as contributing to disaster risk management (DRM) if it (i) identifies the geographical distribution and severity of disaster risk; (ii) identifies specific outputs and outcomes that reflect the proactive management or reduction of disaster risks; (iii) explains how project activities will enhance the environmental, financial, social, or physical resilience to natural hazards and/or reflects DRM targets at the performance level indicator. This also applies to post-disaster recovery and reconstruction in post disaster contexts that need to establish the disaster risk context and demonstrate that interventions increase future resilience.
An operation can be classified as supporting environment and nature if it includes activities that protect, restore, or enhance sustainable management of environment and nature, or enables these actions. This includes (i) activities that reduce pressure on biodiversity or ecosystem services (e.g., land and sea use change, overexploitation, pollution and invasive species); (ii) the integration or mainstreaming of nature (including nature-based solutions), or environmental sustainability into sector investments; and (iii) broader activities needed to enable an economic transition toward practices aligned with environmental sustainability.
Other notes:
Sustainable management includes sustainable use that safeguards ecosystem goods and services and minimizes adverse environmental effects.
Exclusions: Cofinancing, investment facilities, private sector programs, technical assistance, and loans and grants supporting project preparation and design activities; activities undertaken as required by the ADB Safeguard Policy Statement to mitigate or offset the impact of ADB investment
Available data disaggregation: Area (DRM only, nature finance only; both supporting DRM and nature finance), reporting as a tracking indicator; fund source
Performance measurement: Point target
Data source: Annual ADB data (Climate Change and Sustainable Development Department; Private Sector Operations Department; Regional Departments; Sectors Group; Sovereign Operations system)
Private investment
- 2025 ADB: 9.5
Private capital mobilization
- 2025 ADB: 4.7
Definition
Calculation:
Total volume of financing for private investments in $ amount in the given year.
Other notes:
Inclusions: ADB’s own account of NSO OCR long-term financing commitments, ADB-administered third-party blended concessional finance committed in support of NSO OCR long-term financing commitments, and direct mobilization by ADB from both public and private sources.
Financial closure of transactions where ADB has provided Transaction Advisory Services will qualify for direct mobilization. The methodology for qualifying direct mobilization will be based on the harmonized MDB Methodology for Private Investment Mobilization. The total volume of financing will be adjusted for double counting of risk transfer arrangements under OCR and direct mobilization.
Exclusions: short-term financing, such as in the Trade & Supply Chain Finance and Microfinance programs
Available data disaggregation: Fund source (OCR, COL, ADF, mobilization from public sources, mobilization from private sources, blended finance)
Performance measurement: Point target
Data source: Annual ADB data (Office of Markets Development and Public-Private Partnership, Private Sector Operations Department, Strategy, Policy, and Partnerships Department; Sovereign Operations systems)
- 2025 ADB: 50
Definition
Calculation:
Number of committed sovereign operations contributing to private sector development (PSD) (numerator), as a percentage of the total number of sovereign operations committed in the given year (denominator).
Other notes:
All sovereign projects will be reviewed, at the RRP stage, via a PSD Classification Checklist that sets out criteria to assess the alignment and quality of the projects’ contribution to PSD.
Exclusions: Cofinancing, investment facilities, private sector programs, technical assistance, and loans and grants supporting project preparation and design activities.
Available data disaggregation: Fund source
Performance measurement: Point target
Data source: Annual ADB data (Sectors Group; Strategy, Policy, and Partnerships Department; Regional Departments; Sovereign Operations system)
- 2025 ADB: 27
Definition
Calculation:
Number of committed sovereign and nonsovereign operations that contribute to regional cooperation and integration (numerator), as a percentage of total number of ADB operations committed in the given year (denominator).
Definition:
An RCI project promotes collaboration between two or more countries to contribute to economic benefits to more than one country in the region or subregion. An operation classified as RCI must (i) align with relevant national and regional strategies or action plans on RCI and has the government demonstrated commitment and readiness; (ii) contribute to regional economic benefits; and (iii) provide additional support to RCI and ADB’s objectives for regional cooperation and integration.
Other notes:
Exclusions: Cofinancing, investment facilities, private sector programs, technical assistance, and loans and grants supporting project preparation and design activities
Available data disaggregation: Fund source
Performance measurement: Point target
Data source: Annual ADB data (Climate Change and Sustainable Development Department; Private Sector Operations Departments; Regional Departments; Sectors Group; Sovereign Operations system)
- 2025 ADB: 22
Definition
Calculation:
Number of committed sovereign and nonsovereign operations that contribute to digital transformation (numerator), as a percentage of total number of ADB operations committed in the given year (denominator).
Definition:
Digital transformation refers to the strategic adoption and integration of digital technologies into all areas of work and business that fundamentally changes how they operate and deliver services. Operations supporting digital transformation are projects with:
- Implementation of foundational digital infrastructure and solutions (classified under digital technology classification 1 and 3;
- Industry promotion (classified under digital technology classification 2);
- Relevant policies, regulations, and governance (classified under digital technology classification 4 and 5); and
- Capacity development (classified under digital technology classification 5).
Other notes:
Country context and level of digital maturity vary per DMC that will need to be considered for digital transformation. Operations with verified digitalization benefits targeting digital transformation are counted.
The summation of Level 1 and Level 2 should be regarded as “number of committed operations contributing to digital transformation.”
“Level 1” Digital transformation. The number of committed operations whose project outcome directly addresses digital transformation through the implementation of digital infrastructure and solutions, the industry promotion, capacity development, and/or digital governance such as institutional arrangement and data management. Digital transformation is defined as the integration of digital technology into all areas of work and business fundamentally changing how they operate and deliver services. Their project outputs should be in close line with the above-mentioned outcome.
“Level 2” Mainstreaming of digitalization that contributes to digital transformation. The number of committed operations whose project outputs have direct and substantial influence to the project outcomes and/or indirect influence with substantial inputs (approximately 50 percent or more of the total project amount). Digital transformation does not need to be clearly mentioned in the project outcomes.
“Level 3” Digital elements that contribute to digital transformation. The number of committed operations where some digital features are installed.
“Level 4” Limited or no digital elements. The number of committed operations where limited or no digital features are installed or designed.
Exclusions: Cofinancing, investment facilities, private sector programs, technical assistance, and loans and grants supporting project preparation and design activities.
Available data disaggregation: Fund source
Performance measurement: Trend target
Data source: Annual ADB data (Climate Change and Sustainable Development Department; Private Sector Operations Department; Sectors Group; Sovereign Operations system)
- 2025 ADB: 29
Definition
Calculation:
Number of committed sovereign and nonsovereign operations that contribute to poverty reduction and inclusiveness, as a percentage of total number of ADB operations committed in the given year.
Definition:
Projects classified as poverty and inclusion focused (PIF), and with some poverty and inclusion elements (SIP) are counted as contributing to poverty reduction and inclusiveness.
The methodology targets multi-dimensional poverty and beneficiaries who are vulnerable and socially excluded including people with diverse Sexual Orientation, Gender Identity, Expression and Sex Characteristics (SOGIESC).
Other notes:
The basis for the PIF and SIP tagging will be from the analysis using the six impact channels, an ex-ante assessment that explores the various ways a project is likely to impact poverty and social inclusion. The impact channels matrix is a tool that structures poverty and social analysis (PSA) within a common framework across all ADB projects, assessing the relevance of different channels, identifying beneficiaries (particularly poor and marginalized groups), and exploring opportunities and risks. Each channel evaluates the relevance (whether direct or indirect), identifies the extent to which marginalized groups benefit, analyzes opportunities and risks, develops actions, and monitors indicators. The analysis begins at the concept stage, and continues through project preparation to define design options that maximize positive benefits and mitigate risks. The six channels are: employment, prices/wages, transfers/taxes, access to goods and services, assets, and agencies.
Exclusions: Cofinancing, investment facilities, private sector programs, technical assistance, and loans and grants supporting project preparation and design activities.
Available data disaggregation: Fund source
Performance measurement type: Point target
Data source: Annual ADB data (Private Sector Operations Department; Sectors Group; Sovereign Operations system)
- 2025 ADB: 43
Definition
Calculation:
Volume ($ amount) of committed sovereign and nonsovereign operations (including guarantees, equity investments, and B loans) in fragile and conflict-affected situations (FCAS) DMCs and small island developing states (SIDS) (numerator), as a percentage of total volume of committed sovereign and nonsovereign operations in the given year (denominator).
Other notes:
FCAS DMCs and SIDS as described in para. 26–27 of the Strategy 2030 policy paper.
Exclusions: Cofinancing, investment facilities, private sector programs, technical assistance, and loans and grants supporting project preparation and design activities.
Available data disaggregation: Fund source
Performance measurement: Point target
Data source: Annual ADB data (Climate Change and Sustainable Development Department; Private Sector Operations Department; Sectors Group; Sovereign Operations system)
- 2025 ADB: 5.5
Definition
Calculation:
Number of committed nonsovereign operations in frontier economies (i.e., group A and B countries [excluding India], small island developing states, and countries with fragile and conflict-affected situations) (numerator), as a percentage of the total number of nonsovereign operations committed in the given year (denominator).
Definition:
An operation is in a frontier economy if the DMC is classified as a group A or B country, small island developing state, and/or with fragile and conflict-affected situation on the date of the operation’s approval.
Other notes:
Exclusions: Cofinancing, investment facilities and technical assistance
Disaggregation: Fund source
Performance measurement type: Point target
Data source: Annual ADB data (Private Sector Operations Department)
- 2025 ADB: 71
Definition
Calculation:
Number of committed sovereign and nonsovereign operations that promote gender equality (including targeted operations to empower women and girls [categorized gender equality objective] and gender mainstreamed operations that directly narrow gender gaps or benefit women and girls [categorized effective gender mainstreaming]) (numerator), expressed as a percentage of the total number of sovereign and nonsovereign operations committed in the given year (denominator).
Other notes:
Exclusions: Cofinancing, investment facilities, private sector programs, technical assistance, and loans and grants supporting project preparation and design activities.
Available data disaggregation: Type: GEN, EGM (a tracking indicator); fund source
Performance measurement: Point target
Data source: Annual ADB data (Climate Change and Sustainable Development Department; Sovereign Operations system)
ADF
- 2025 ADF: 57
Definition
Calculation:
Annual volume, in $ amount, of committed sovereign and nonsovereign ADB operations supporting climate change mitigation and/or adaptation (numerator), expressed as a percentage of total ADB operations committed in the given year (numerator).
Other notes:
Inclusion: Financing from ADB ordinary and concessional capital resources and Asian Development Fund.
Exclusions: Cofinancing, investment facilities, private sector programs, technical assistance, transaction advisory services, and loans and grants supporting project preparation and design activities.
Available data disaggregation: Activities (mitigation, adaptation, both), and fund source, both reporting as tracking indicators
Performance measurement: Point target
Data source: Annual ADB data (Climate Change and Sustainable Development Department; Private Sector Operations Department; Regional Departments; Sectors Group; Sovereign Operations system)
- 2025 ADF: 53
Definition
Calculation:
Number of sovereign and nonsovereign operations committed that support disaster risk management, and environment and nature (numerator), as a percentage of the total number of sovereign and nonsovereign operations committed in the given year (denominator).
Definition:
An operation can be classified as contributing to disaster risk management (DRM) if it (i) identifies the geographical distribution and severity of disaster risk; (ii) identifies specific outputs and outcomes that reflect the proactive management or reduction of disaster risks; (iii) explains how project activities will enhance the environmental, financial, social, or physical resilience to natural hazards and/or reflects DRM targets at the performance level indicator. This also applies to post-disaster recovery and reconstruction in post disaster contexts that need to establish the disaster risk context and demonstrate that interventions increase future resilience.
An operation can be classified as supporting environment and nature if it includes activities that protect, restore, or enhance sustainable management of environment and nature, or enables these actions. This includes (i) activities that reduce pressure on biodiversity or ecosystem services (e.g., land and sea use change, overexploitation, pollution and invasive species); (ii) the integration or mainstreaming of nature (including nature-based solutions), or environmental sustainability into sector investments; and (iii) broader activities needed to enable an economic transition toward practices aligned with environmental sustainability.
Other notes:
Sustainable management includes sustainable use that safeguards ecosystem goods and services and minimizes adverse environmental effects.
Exclusions: Cofinancing, investment facilities, private sector programs, technical assistance, and loans and grants supporting project preparation and design activities; activities undertaken as required by the ADB Safeguard Policy Statement to mitigate or offset the impact of ADB investment
Available data disaggregation: Area (DRM only, nature finance only; both supporting DRM and nature finance), reporting as a tracking indicator; fund source
Performance measurement: Point target
Data source: Annual ADB data (Climate Change and Sustainable Development Department; Private Sector Operations Department; Regional Departments; Sectors Group; Sovereign Operations system)

No results available
Private investment
- 2025 ADF: Not applicable
Private capital mobilization
- 2025 ADF: Not applicable
Definition
Calculation:
Total volume of financing for private investments in $ amount in the given year.
Other notes:
Inclusions: ADB’s own account of NSO OCR long-term financing commitments, ADB-administered third-party blended concessional finance committed in support of NSO OCR long-term financing commitments, and direct mobilization by ADB from both public and private sources.
Financial closure of transactions where ADB has provided Transaction Advisory Services will qualify for direct mobilization. The methodology for qualifying direct mobilization will be based on the harmonized MDB Methodology for Private Investment Mobilization. The total volume of financing will be adjusted for double counting of risk transfer arrangements under OCR and direct mobilization.
Exclusions: short-term financing, such as in the Trade & Supply Chain Finance and Microfinance programs
Available data disaggregation: Fund source (OCR, COL, ADF, mobilization from public sources, mobilization from private sources, blended finance)
Performance measurement: Point target
Data source: Annual ADB data (Office of Markets Development and Public-Private Partnership, Private Sector Operations Department, Strategy, Policy, and Partnerships Department; Sovereign Operations systems)
No results available
- 2025 ADF: 35
Definition
Calculation:
Number of committed sovereign operations contributing to private sector development (PSD) (numerator), as a percentage of the total number of sovereign operations committed in the given year (denominator).
Other notes:
All sovereign projects will be reviewed, at the RRP stage, via a PSD Classification Checklist that sets out criteria to assess the alignment and quality of the projects’ contribution to PSD.
Exclusions: Cofinancing, investment facilities, private sector programs, technical assistance, and loans and grants supporting project preparation and design activities.
Available data disaggregation: Fund source
Performance measurement: Point target
Data source: Annual ADB data (Sectors Group; Strategy, Policy, and Partnerships Department; Regional Departments; Sovereign Operations system)
No results available
- 2025 ADF: 100
Definition
Calculation:
Number of committed sovereign and nonsovereign operations that contribute to regional cooperation and integration (numerator), as a percentage of total number of ADB operations committed in the given year (denominator).
Definition:
An RCI project promotes collaboration between two or more countries to contribute to economic benefits to more than one country in the region or subregion. An operation classified as RCI must (i) align with relevant national and regional strategies or action plans on RCI and has the government demonstrated commitment and readiness; (ii) contribute to regional economic benefits; and (iii) provide additional support to RCI and ADB’s objectives for regional cooperation and integration.
Other notes:
Exclusions: Cofinancing, investment facilities, private sector programs, technical assistance, and loans and grants supporting project preparation and design activities
Available data disaggregation: Fund source
Performance measurement: Point target
Data source: Annual ADB data (Climate Change and Sustainable Development Department; Private Sector Operations Departments; Regional Departments; Sectors Group; Sovereign Operations system)
- 2025 ADF: 31
Definition
Calculation:
Number of committed sovereign and nonsovereign operations that contribute to digital transformation (numerator), as a percentage of total number of ADB operations committed in the given year (denominator).
Definition:
Digital transformation refers to the strategic adoption and integration of digital technologies into all areas of work and business that fundamentally changes how they operate and deliver services. Operations supporting digital transformation are projects with:
- Implementation of foundational digital infrastructure and solutions (classified under digital technology classification 1 and 3;
- Industry promotion (classified under digital technology classification 2);
- Relevant policies, regulations, and governance (classified under digital technology classification 4 and 5); and
- Capacity development (classified under digital technology classification 5).
Other notes:
Country context and level of digital maturity vary per DMC that will need to be considered for digital transformation. Operations with verified digitalization benefits targeting digital transformation are counted.
The summation of Level 1 and Level 2 should be regarded as “number of committed operations contributing to digital transformation.”
“Level 1” Digital transformation. The number of committed operations whose project outcome directly addresses digital transformation through the implementation of digital infrastructure and solutions, the industry promotion, capacity development, and/or digital governance such as institutional arrangement and data management. Digital transformation is defined as the integration of digital technology into all areas of work and business fundamentally changing how they operate and deliver services. Their project outputs should be in close line with the above-mentioned outcome.
“Level 2” Mainstreaming of digitalization that contributes to digital transformation. The number of committed operations whose project outputs have direct and substantial influence to the project outcomes and/or indirect influence with substantial inputs (approximately 50 percent or more of the total project amount). Digital transformation does not need to be clearly mentioned in the project outcomes.
“Level 3” Digital elements that contribute to digital transformation. The number of committed operations where some digital features are installed.
“Level 4” Limited or no digital elements. The number of committed operations where limited or no digital features are installed or designed.
Exclusions: Cofinancing, investment facilities, private sector programs, technical assistance, and loans and grants supporting project preparation and design activities.
Available data disaggregation: Fund source
Performance measurement: Trend target
Data source: Annual ADB data (Climate Change and Sustainable Development Department; Private Sector Operations Department; Sectors Group; Sovereign Operations system)
- 2025 ADF: 13
Definition
Calculation:
Number of committed sovereign and nonsovereign operations that contribute to poverty reduction and inclusiveness, as a percentage of total number of ADB operations committed in the given year.
Definition:
Projects classified as poverty and inclusion focused (PIF), and with some poverty and inclusion elements (SIP) are counted as contributing to poverty reduction and inclusiveness.
The methodology targets multi-dimensional poverty and beneficiaries who are vulnerable and socially excluded including people with diverse Sexual Orientation, Gender Identity, Expression and Sex Characteristics (SOGIESC).
Other notes:
The basis for the PIF and SIP tagging will be from the analysis using the six impact channels, an ex-ante assessment that explores the various ways a project is likely to impact poverty and social inclusion. The impact channels matrix is a tool that structures poverty and social analysis (PSA) within a common framework across all ADB projects, assessing the relevance of different channels, identifying beneficiaries (particularly poor and marginalized groups), and exploring opportunities and risks. Each channel evaluates the relevance (whether direct or indirect), identifies the extent to which marginalized groups benefit, analyzes opportunities and risks, develops actions, and monitors indicators. The analysis begins at the concept stage, and continues through project preparation to define design options that maximize positive benefits and mitigate risks. The six channels are: employment, prices/wages, transfers/taxes, access to goods and services, assets, and agencies.
Exclusions: Cofinancing, investment facilities, private sector programs, technical assistance, and loans and grants supporting project preparation and design activities.
Available data disaggregation: Fund source
Performance measurement type: Point target
Data source: Annual ADB data (Private Sector Operations Department; Sectors Group; Sovereign Operations system)
- 2025 ADF: 50
Definition
Calculation:
Volume ($ amount) of committed sovereign and nonsovereign operations (including guarantees, equity investments, and B loans) in fragile and conflict-affected situations (FCAS) DMCs and small island developing states (SIDS) (numerator), as a percentage of total volume of committed sovereign and nonsovereign operations in the given year (denominator).
Other notes:
FCAS DMCs and SIDS as described in para. 26–27 of the Strategy 2030 policy paper.
Exclusions: Cofinancing, investment facilities, private sector programs, technical assistance, and loans and grants supporting project preparation and design activities.
Available data disaggregation: Fund source
Performance measurement: Point target
Data source: Annual ADB data (Climate Change and Sustainable Development Department; Private Sector Operations Department; Sectors Group; Sovereign Operations system)
- 2025 ADF: 75
Definition
Calculation:
Number of committed nonsovereign operations in frontier economies (i.e., group A and B countries [excluding India], small island developing states, and countries with fragile and conflict-affected situations) (numerator), as a percentage of the total number of nonsovereign operations committed in the given year (denominator).
Definition:
An operation is in a frontier economy if the DMC is classified as a group A or B country, small island developing state, and/or with fragile and conflict-affected situation on the date of the operation’s approval.
Other notes:
Exclusions: Cofinancing, investment facilities and technical assistance
Disaggregation: Fund source
Performance measurement type: Point target
Data source: Annual ADB data (Private Sector Operations Department)
- 2025 ADF: 72
Definition
Calculation:
Number of committed sovereign and nonsovereign operations that promote gender equality (including targeted operations to empower women and girls [categorized gender equality objective] and gender mainstreamed operations that directly narrow gender gaps or benefit women and girls [categorized effective gender mainstreaming]) (numerator), expressed as a percentage of the total number of sovereign and nonsovereign operations committed in the given year (denominator).
Other notes:
Exclusions: Cofinancing, investment facilities, private sector programs, technical assistance, and loans and grants supporting project preparation and design activities.
Available data disaggregation: Type: GEN, EGM (a tracking indicator); fund source
Performance measurement: Point target
Data source: Annual ADB data (Climate Change and Sustainable Development Department; Sovereign Operations system)
Operational Management
ADB Overall
- 2025 ADB: 78
Definition
Calculation:
The average percentage achievement of the five tracking indicators for all infrastructure projects approved in the last calendar year.
Definition:
Operations that are implementation-ready before approval are based on five criteria, which are: (a) design ready; (b) financial management ready; (c) institutional ready (d) procurement ready; and (e) safeguards ready. Details for each criterion are provided in the tracking indicator definition file.
Other notes:
Exclusions: Non-infrastructure projects; policy-based loans, results-based loans, technical assistance, and loans and grants supporting project preparation and design activities.
Available data disaggregation: Fund source
Performance measurement type: Trend target
Data source: Annual ADB data (Procurement, Portfolio, and Financial Management Department; Office of Safeguards (OFSG); Regional Departments; Sectors Group; Sovereign Operations system)
- 2025 ADB: 2.6
Definition
Calculation:
Number of active sovereign operations under implementation rated at risk by PPR System for four consecutive quarters or more based on five performance indicators: (a) output; (b) contract award; (c) disbursement; (d) financial management; and (e) safeguards (numerator), as a percentage of the total number of active sovereign operations as of 31 December of the reporting year (denominator).
Other notes:
Exclusions: investment facilities, project loans and grants not administered by ADB, policy-based loans, technical assistance, loans and grants supporting project preparation and design activities
Available data disaggregation: Fund source
Performance measurement: Periodic performance
Data source: Annual ADB data (Procurement, Portfolio, and Financial Management Department; Office of Safeguards; Regional Departments; Sectors Group; eOperations and Sovereign Operations system)
- 2025 ADB: 12
Definition
Calculation:
Number of nonsovereign operations under implementation that were assessed as being “at risk of not achieving development results” (numerator), as a percentage of the total number of nonsovereign operations under implementation as of 31 December of the reporting year (denominator).
Definition:
“Nonsovereign operations under implementation” are nonsovereign operations that were committed after 1 January 2012, that are not canceled and for which the extended annual review report (XARR) has not been circulated to the Board. In case a project performance evaluation report (PPER), but no XARR is or will be circulated to the board, the date of the final PPER should be used instead of the XARR circulation date.
“At risk of not achieving development results” means that the last assessment of the development results (based on the latest development effectiveness monitoring report (DEMR)) classified the transaction as being at risk of not achieving its major envisaged development results within the planned time frame. The risk assessment will be based on the timeliness of submission of the DEMR and on the achievement of output and outcome performance indicators.
Development results refer to the outcome and outputs as indicated in the design and monitoring framework (DMF).
Other notes:
Exclusions: Investment facilities, technical assistance
Available data disaggregation: N/A
Performance measurement: Periodic performance
Data source: Annual ADB data (DEMR data of Private Sector Operations Department)
ADF
- 2025 ADF: 65
Definition
Calculation:
The average percentage achievement of the five tracking indicators for all infrastructure projects approved in the last calendar year.
Definition:
Operations that are implementation-ready before approval are based on five criteria, which are: (a) design ready; (b) financial management ready; (c) institutional ready (d) procurement ready; and (e) safeguards ready. Details for each criterion are provided in the tracking indicator definition file.
Other notes:
Exclusions: Non-infrastructure projects; policy-based loans, results-based loans, technical assistance, and loans and grants supporting project preparation and design activities.
Available data disaggregation: Fund source
Performance measurement type: Trend target
Data source: Annual ADB data (Procurement, Portfolio, and Financial Management Department; Office of Safeguards (OFSG); Regional Departments; Sectors Group; Sovereign Operations system)
- 2025 ADF: 1.3
Definition
Calculation:
Number of active sovereign operations under implementation rated at risk by PPR System for four consecutive quarters or more based on five performance indicators: (a) output; (b) contract award; (c) disbursement; (d) financial management; and (e) safeguards (numerator), as a percentage of the total number of active sovereign operations as of 31 December of the reporting year (denominator).
Other notes:
Exclusions: investment facilities, project loans and grants not administered by ADB, policy-based loans, technical assistance, loans and grants supporting project preparation and design activities
Available data disaggregation: Fund source
Performance measurement: Periodic performance
Data source: Annual ADB data (Procurement, Portfolio, and Financial Management Department; Office of Safeguards; Regional Departments; Sectors Group; eOperations and Sovereign Operations system)
No results available
- 2025 ADF: Not applicable
Definition
Calculation:
Number of nonsovereign operations under implementation that were assessed as being “at risk of not achieving development results” (numerator), as a percentage of the total number of nonsovereign operations under implementation as of 31 December of the reporting year (denominator).
Definition:
“Nonsovereign operations under implementation” are nonsovereign operations that were committed after 1 January 2012, that are not canceled and for which the extended annual review report (XARR) has not been circulated to the Board. In case a project performance evaluation report (PPER), but no XARR is or will be circulated to the board, the date of the final PPER should be used instead of the XARR circulation date.
“At risk of not achieving development results” means that the last assessment of the development results (based on the latest development effectiveness monitoring report (DEMR)) classified the transaction as being at risk of not achieving its major envisaged development results within the planned time frame. The risk assessment will be based on the timeliness of submission of the DEMR and on the achievement of output and outcome performance indicators.
Development results refer to the outcome and outputs as indicated in the design and monitoring framework (DMF).
Other notes:
Exclusions: Investment facilities, technical assistance
Available data disaggregation: N/A
Performance measurement: Periodic performance
Data source: Annual ADB data (DEMR data of Private Sector Operations Department)
Organizational Effectiveness
ADB Overall
- 2025 ADB: 41.4
Definition
Calculation:
Number of women staff who have been internationally recruited (previously referred to as international staff (IS)) (numerator), as a percentage of the total number of IS in a budget year (denominator).
Other notes:
The indicator is also a corporate or transformation KPI used to measure the effectiveness of ADB’s New Operating Model for the 2024–2027 period.
Available data disaggregation: Managerial job structure (reporting as a tracking indicator
Performance measurement: Point target
Data source: Annual ADB data (Gender database of Budget, People, and Management Systems Department)
- 2025 ADB: 830
Definition
Calculation:
Number of international and local technical staff located in ADB’s field offices in the budget year.
Definition:
Technical staff are individuals hired from job grades: technical local 4 (TL4) to technical international 4 (TI4) (previously referred to as administrative staff level 7 (AS7) to international staff level 6 (IS6)).
Staff count includes (i) all individuals in field offices, either field office staff or outposted, (ii) regardless of job roles or originating departments.
Other notes:
Exclusions: staff on special leave without pay (SLWOP), staff on external assignment, and positions on secondee agreement.
Available data disaggregation: FCAS-classified DMCs and SIDS (reporting it as a tracking indicator)
Performance measurement: Trend target
Data source: Annual ADB data (HR dashboard of Budget, People, and Management Systems Department)
- 2025 ADB: 1.5
Definition
Calculation:
Total rating of ADB’s knowledge management (KM) maturity level, based on the American Productivity and Quality Center’s (APQC) Knowledge Management Capability Assessment Tool (KMCAT), on a scale of 1 to 5.
Definition:
The KM maturity score is based on a survey of selected ADB KM focal points, based on the internationally recognized KMCAT from the American Productivity and Quality Center. This comprehensive assessment evaluates ADB’s knowledge management effectiveness across four key areas: (i) knowledge management strategy, (ii) knowledge management processes, (iii) cultural elements (people), and (iv) support for content management and information technology. By using this standardized tool, ADB can assess its current KM capabilities, identify areas for improvement, prioritize actions to enhance KM effectiveness, and benchmark its KM maturity against international standards. This assessment provides a holistic view of ADB’s KM system, enabling targeted efforts to increase organizational KM capability and align with best practices in the field.
The KMCAT has four categories—strategy, people, process, and content and information—that are further broken down into 12 capability domains where each is given a score ranging from 1 (lowest) to 5 (highest) points to assess the knowledge management maturity level.
Other notes:
Available data disaggregation: N/A
Performance measurement: Point target
Frequency: Every two years for KM maturity rating; annual reporting on specific domains.
Source: The American Productivity and Quality Center’s report on KMCAT (c/o Department of Communications and Knowledge Management)
- 2025 ADB: 60
Definition
Calculation:
The ratio of internal administrative expenses from Ordinary Capital Resources (OCR) and Asian Development Fund (ADF) (numerator) to income from loans and guarantees before provision for credit losses from OCR (denominator).
Other notes:
Available data disaggregation: N/A
Performance measurement: Point target
Source: Annual ADB data (Budget, People, and Management Systems Department, and Treasury Department)
- 2025 ADB: 16
Definition
Calculation:
Number of ADB staff attaining digital competency level 3, based on the digital competency assessment* (numerator), as percentage of total ADB staff in the given year (denominator).
Definition:
Attaining digital competency levels 1 and 2 are mandatory for staff. Digital competency level 3, which reflects intermediate knowledge and application of digital skills in staff work, will not be mandatory. This requires undergoing intermediate-level courses, demonstrating applied knowledge scenarios, and passing an annual assessment on the latest digital technologies and trends. This indicator will report based on technical local job grades (TL) 1–8, technical international job grades (TI) 1–4 and managerial job grades (M) 1–3 under the new job architecture.
*Competency assessment is measured in five levels: Levels 1 and 2: Mandatory digital awareness short courses and performance of basic applications, including an annual assessment; Level 3: Intermediate courses and applied knowledge scenarios, including self-assessment and supervisor’s digital competency appraisal; Level 4: Advanced programs, such as Driving Digital Leadership, external certifications, including self-assessment, supervisor’s digital competency appraisal and capstone projects; Level 5: Expert in digital technologies recognized by external authorities/industry. Levels 4 and 5 recognize that for certain jobs, higher levels of digital competency will be required which will not be relevant for all staff to attain. These levels will require more tailored assessment of digital skills.
Other notes:
Available data disaggregation: N/A
Performance measurement: Point target
Data source: Annual ADB data (ADB Indigo [a learning experience platform] of Information Technology Department, and HR records of Budget, People, and Management Systems Department)
- 2025 ADB: 85,768.00
Definition
Calculation:
Total of ADB’s corporate greenhouse gas (GHG) emissions in terms of tons of carbon dioxide equivalent (tCO2e) reported for the calendar year.
Definition:
Corporate refers to ADB’s internal operations and various activities encompassing the operations of the ADB headquarters and all ADB Resident Missions.
GHG emissions refer to the consolidated and aggregate reporting of direct, indirect and other indirect GHG emissions. Direct GHG emissions (Scope 1) are from sources owned and controlled by ADB. Energy indirect GHG emissions (Scope 2) are emissions from the generation of purchased electricity. Other indirect GHG emissions (Scope 3) are emissions from other activities that ADB reports in the Sustainability Report.
The full methodology for determining emissions in these scopes is based on the Global Reporting Initiative (GRI) Standards and the GHG Protocol’s Corporate Standard.
Other notes:
Disaggregation: N/A
Performance measurement: Trend target
Data source: Annual ADB data (Sustainability Report of Climate Change and Sustainable Development Department and Corporate Services Development)
ADF
No results available
- 2025 ADF: Not applicable
Definition
Calculation:
Number of women staff who have been internationally recruited (previously referred to as international staff (IS)) (numerator), as a percentage of the total number of IS in a budget year (denominator).
Other notes:
The indicator is also a corporate or transformation KPI used to measure the effectiveness of ADB’s New Operating Model for the 2024–2027 period.
Available data disaggregation: Managerial job structure (reporting as a tracking indicator
Performance measurement: Point target
Data source: Annual ADB data (Gender database of Budget, People, and Management Systems Department)
- 2025 ADF: 56
Definition
Calculation:
Number of international and local technical staff located in ADB’s field offices in the budget year.
Definition:
Technical staff are individuals hired from job grades: technical local 4 (TL4) to technical international 4 (TI4) (previously referred to as administrative staff level 7 (AS7) to international staff level 6 (IS6)).
Staff count includes (i) all individuals in field offices, either field office staff or outposted, (ii) regardless of job roles or originating departments.
Other notes:
Exclusions: staff on special leave without pay (SLWOP), staff on external assignment, and positions on secondee agreement.
Available data disaggregation: FCAS-classified DMCs and SIDS (reporting it as a tracking indicator)
Performance measurement: Trend target
Data source: Annual ADB data (HR dashboard of Budget, People, and Management Systems Department)
No results available
- 2025 ADF: Not applicable
Definition
Calculation:
Total rating of ADB’s knowledge management (KM) maturity level, based on the American Productivity and Quality Center’s (APQC) Knowledge Management Capability Assessment Tool (KMCAT), on a scale of 1 to 5.
Definition:
The KM maturity score is based on a survey of selected ADB KM focal points, based on the internationally recognized KMCAT from the American Productivity and Quality Center. This comprehensive assessment evaluates ADB’s knowledge management effectiveness across four key areas: (i) knowledge management strategy, (ii) knowledge management processes, (iii) cultural elements (people), and (iv) support for content management and information technology. By using this standardized tool, ADB can assess its current KM capabilities, identify areas for improvement, prioritize actions to enhance KM effectiveness, and benchmark its KM maturity against international standards. This assessment provides a holistic view of ADB’s KM system, enabling targeted efforts to increase organizational KM capability and align with best practices in the field.
The KMCAT has four categories—strategy, people, process, and content and information—that are further broken down into 12 capability domains where each is given a score ranging from 1 (lowest) to 5 (highest) points to assess the knowledge management maturity level.
Other notes:
Available data disaggregation: N/A
Performance measurement: Point target
Frequency: Every two years for KM maturity rating; annual reporting on specific domains.
Source: The American Productivity and Quality Center’s report on KMCAT (c/o Department of Communications and Knowledge Management)
No results available
- 2025 ADF: Not applicable
Definition
Calculation:
The ratio of internal administrative expenses from Ordinary Capital Resources (OCR) and Asian Development Fund (ADF) (numerator) to income from loans and guarantees before provision for credit losses from OCR (denominator).
Other notes:
Available data disaggregation: N/A
Performance measurement: Point target
Source: Annual ADB data (Budget, People, and Management Systems Department, and Treasury Department)
No results available
- 2025 ADF: Not applicable
Definition
Calculation:
Number of ADB staff attaining digital competency level 3, based on the digital competency assessment* (numerator), as percentage of total ADB staff in the given year (denominator).
Definition:
Attaining digital competency levels 1 and 2 are mandatory for staff. Digital competency level 3, which reflects intermediate knowledge and application of digital skills in staff work, will not be mandatory. This requires undergoing intermediate-level courses, demonstrating applied knowledge scenarios, and passing an annual assessment on the latest digital technologies and trends. This indicator will report based on technical local job grades (TL) 1–8, technical international job grades (TI) 1–4 and managerial job grades (M) 1–3 under the new job architecture.
*Competency assessment is measured in five levels: Levels 1 and 2: Mandatory digital awareness short courses and performance of basic applications, including an annual assessment; Level 3: Intermediate courses and applied knowledge scenarios, including self-assessment and supervisor’s digital competency appraisal; Level 4: Advanced programs, such as Driving Digital Leadership, external certifications, including self-assessment, supervisor’s digital competency appraisal and capstone projects; Level 5: Expert in digital technologies recognized by external authorities/industry. Levels 4 and 5 recognize that for certain jobs, higher levels of digital competency will be required which will not be relevant for all staff to attain. These levels will require more tailored assessment of digital skills.
Other notes:
Available data disaggregation: N/A
Performance measurement: Point target
Data source: Annual ADB data (ADB Indigo [a learning experience platform] of Information Technology Department, and HR records of Budget, People, and Management Systems Department)
No results available
- 2025 ADF: Not applicable
Definition
Calculation:
Total of ADB’s corporate greenhouse gas (GHG) emissions in terms of tons of carbon dioxide equivalent (tCO2e) reported for the calendar year.
Definition:
Corporate refers to ADB’s internal operations and various activities encompassing the operations of the ADB headquarters and all ADB Resident Missions.
GHG emissions refer to the consolidated and aggregate reporting of direct, indirect and other indirect GHG emissions. Direct GHG emissions (Scope 1) are from sources owned and controlled by ADB. Energy indirect GHG emissions (Scope 2) are emissions from the generation of purchased electricity. Other indirect GHG emissions (Scope 3) are emissions from other activities that ADB reports in the Sustainability Report.
The full methodology for determining emissions in these scopes is based on the Global Reporting Initiative (GRI) Standards and the GHG Protocol’s Corporate Standard.
Other notes:
Disaggregation: N/A
Performance measurement: Trend target
Data source: Annual ADB data (Sustainability Report of Climate Change and Sustainable Development Department and Corporate Services Development)